I. Tianjin Shipping Index (TSI)
In Week 19, 2025 (May 5 to May 9), the Tianjin Shipping Index (TSI)was released four times due to schedule adjustments for the May Day holiday. Tianjin Container Freight Index (TCI) continued to decline, Tianjin Bulk Freight Index (TBI) fell continuously throughout the week, and Tianjin Domestic Container Freight Index (TDI) rose significantly. The TSI first dropped and then rose, ultimately closing at 1010.02 points, ith a cumulative decline of 0.12points (0.01%) compared to Apr. 30 (the last release day of Week 18). The trend of TSI is as follows:
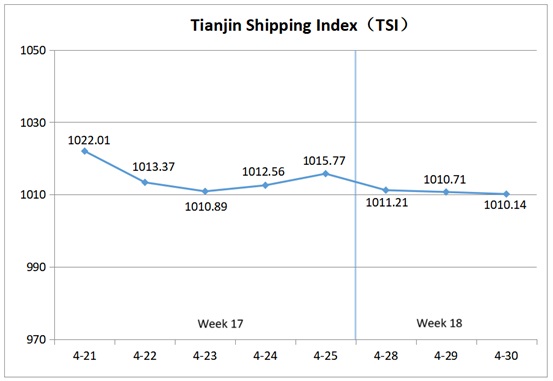
The value and trend of TSI is as follows:
II. Tianjin Container Freight Index (TCI)
In Week 19, 2025 (May 5 to May 9), the trend of Tianjin Container Freight Index (TCI) is as follows:
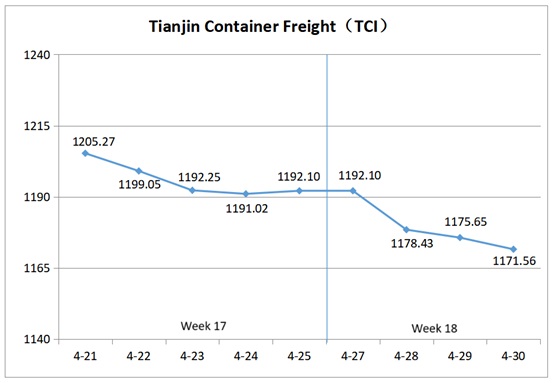
In Week 18, the TCI continued to decline.
From May 6 to May 7 (Tue. to Wed.), the freight rates in European route and South American route dropped rapidly, while the freight rates in Mediterranean route, American route and East African route remained strong. The TCI continued to decline, falling by a cumulative 0.69% over the two release days. Subsequently, the freight rates in European route, Mediterranean route and South American West route rose increased slightly, while those in South American East route increased more significantly. The freight rates in American route stabilized. The TCI fluctuated slightly downward, falling by a cumulative 0.03% from May 8 to May 9 (Thur. to Fri.). Finally, the TCI closed at 1,163.03 points, with a cumulative drop of 8.53 points (0.73%) from Apr.30(the last release day of Week 18).
The TCI index value and several ups and downs on a day-on-day basis are as follows:
The TCI includes 19 sample routes. The main route analysis of this week is as follows:
European/Mediterranean route Freight rates showed mixed movements. For the European route, after the May Day holiday, the market cargo volume dropped, and shipping companies reduced freight rates. The freight indices closed at 599.32 points, with a week-on-week decrease of 5.94%. For the Mediterranean route, affected by congestion at the destination port, shipping companies reduced the number of voyages, and the freight indices continued to rise. The freight indices of the Tianjin to East Mediterranean and Tianjin to West Mediterranean routes closed at 932.46 points and 1194.36 points respectively, with week-on-week increases of 4.12% and 4.25%.
American route The market shipping volume rebounded slightly, and the spot shipping capacity was tight. The freight rates continued to rise during this week. The freight indices of the Tianjin to American West Coast and Tianjin to American East Coast routes closed at 926.26 points and 922.06 points respectively, with week-on-week increases of 6.35% and 2.54%.
South American route Cargo volumes continued to fall after the holiday, and route capacity increased. In the first half of the week, market freight rates continued to decline. In the second half of the week, freight rate trends diverged. some shipping companies on the South American West route, imposed overweight surcharges, and freight rates rose slightly. However, the overall weekly trend was still downward, with the freight index closing at 626.14 points, down 3.90% week-on-week. Shipping companies on the South American East route added a bunker adjustment factor (BAF), and the freight rate increase was slightly larger. However, the weekly freight index still decreased by 3.78%, closing at 718.44 points. The increase in the number of liner passages through the Panama Canal continued to put pressure on the freight rates of the Central and South American routes, and the freight rates continued to decline. The freight index closed at 784.10 points, with a week-on-week decrease of 10.67%.
East Africa route The congestion at major local ports remained severe. Shipping companies imposed port congestion surcharges (PSS) and general rate increases (GRI), and the freight rates remained strong. The freight index closed at 1271.46 points, with a week-on-week increase of 10.65%.
III. Tianjin Bulk Freight Index (TBI)
In Week 19, 2025 (May 6 to May 9), the trend of Tianjin Bulk Freight Index (TBI) was released as shown as follows:
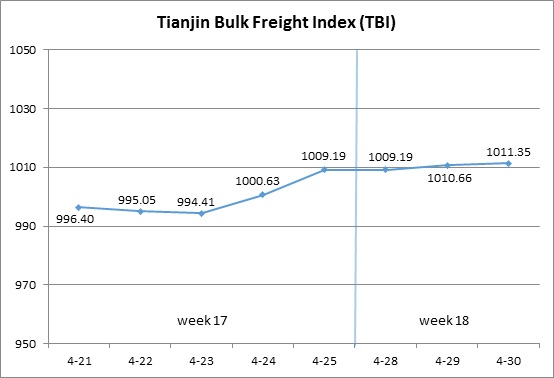
In Week 19, the TBI was generally weak.
From May 6 to 7 (Tue. to Wed.), the market freight rates of coal, grain and metal ores all showed a slight downward trend. The TBI continued to decline, with a cumulative drop of 0.36% over the two release days. Subsequently, the freight rates in the grain market slightly stabilized, while those in the coal and metal ore markets continued to be weak and the decline widened. The TBI further declined from May 8 to 9 (Thur. to Fri.) and finally closed at 997.76 points, a cumulative drop of 13.59 points or 1.34% compared to Apr.30 (the last release day of Week 18).
The TBI index value and several ups and downs on a day-on-day basis are as follows:
TBCI Closed at 752.50 points, down 10.26 points from Apr.30 (the last release day of the Week 18), with a cumulative decline of 1.35%. The increase in the price of imported coal has curbed the import demand, and the market freight rate has declined. In the Supramax market, there is a relatively small number of imported cargo orders from Indonesia, and the available capacity is abundant. The freight index for the Indonesia to Qingdao route dropped by 0.76% week-on-week. In the Capesize vessel market, the freight index for the the Hay Point to Qingdao route has also continued to decline, dropping by 1.72% week-on-week.
TBGI Closed at 881.81 points, a cumulative decrease of 2.23 points or 0.25% compared to Apr.30 (the last release day of Week 18). The demand for soybean transportation in Brazil is still acceptable, but there is an excess of spot capacity for Panamax ships, and market freight rates have slightly fluctuated and weakened. The freight index for the South American to Tianjin route decreased by 0.80% on a weekly basis, while the freight index for the West American to Tianjin route decreased by 0.36% on a weekly basis. In contrast, the freight index for the route from US Gulf to Tianjin increased by 0.16% on a weekly basis.
TBMI Closed at 1358.96 points, a cumulative decrease of 28.29 points or 2.04% compared to Apr.30 (the last release day of the Week 18). In terms of iron ore, after the May Day holiday, there was a significant decrease in Australian cargo pallets, an increase in available capacity in Brazil, and a continuous decline in market freight rates. The freight index for the Australia West Coast to North China route fell by 2.07% week on week, and the freight index for the Brazil to Tianjin route fell by 3.23% week on week. In terms of nickel ore, the number of nickel ore shipments in the Philippines continues to increase, but the overall market capacity is abundant. The freight index for the Surigao to Tianjin route increased slightly by 0.34% on a weekly basis.
IV. Tianjin Domestic Container Freight Index (TDI)
In Week 19 (May 6-May 9), the trend of the Tianjin Domestic Container Freight Index (TDI) is shown in the chart below:
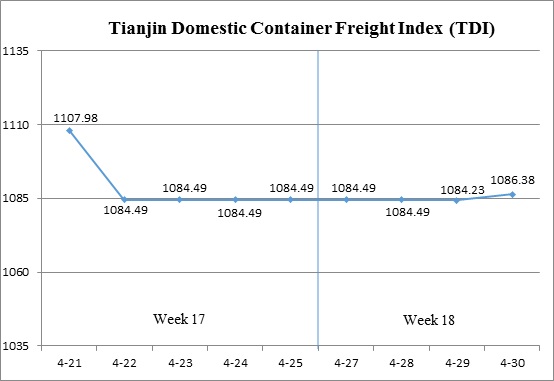
During Week 19, the Tianjin Domestic Container Freight Index (TDI) experienced a significant rebound.
On May 6 (Tue.), both the inbound and outbound indices remained stable. From May 7 to 8 (Wed. to Thur.), the inbound index recorded a slight increase, while the outbound index saw a sharp rise, driving the overall TDI noticeably higher, pushing it back above the 1100-point mark. By May 9 (Fri.), the TDI stabilized and ultimately closed at 1114.28 points, a cumulative increase of 27.90 points or 2.57% compared to Apr.30(the last release day of Week 18).
The TDI index value and several ups and downs on a day-on-day basis are as follows:
The Tianjin Domestic Container Outward Freight Index (TDOI) Recorded a notable surge, closing at 1049.73 points on May 9, marking a cumulative increase of 39.53 points or 3.91% compared to Apr.30 (the last release day of Week 18). Following the holiday period, freight rates on the Tianjin to South China route rose significantly. The freight index for the Tianjin to Guangzhou route closed at 1023.33 points, representing a week-on-week increase of 7.72%. The freight rates on the Tianjin to Fujian route experienced a sharp decline, with the Tianjin to Quanzhou/Xiamen index falling to 1134.92 points, down 9.06% from the previous week. Meanwhile, freight rates from Tianjin to East China stabilized. The freight index for the Tianjin to Shanghai route closed at 1144.15 points, unchanged from the previous week.
The Tianjin Domestic Container Inward Freight Index (TDII) Posted a slight gain, closing at 1178.83 points on May 9, marking a cumulative increase of 16.28 points or 1.40% compared to Apr.30 (the last release day of Week 18). Freight rates in the Fujian market continued to rise, with the Quanzhou/Xiamen to Tianjin route index reaching 956.75 points, up 10.44% week-on-week. The freight rates in the East China and South China markets remained stable. The freight indices for the Shanghai to Tianjin and Guangzhou to Tianjin route closed at 1061.42 points and 1250.66 points respectively, both unchanged from the previous week.
(The analysis report is for reference only and at your own risk)
