I. Tianjin Shipping Index (TSI)
In Week 24, 2025 (June 9 to June 13), the Tianjin Container Freight Index (TCI) showed a slowdown after a sustained upward trend, the Tianjin Bulk Freight Index (TBI) fell first and then rose, Tianjin Domestic Container Freight Index (TDI) fell first and then rose. The Tianjin Shipping Index (TSI) fluctuated upward and finally closed at 1,166.16 points, with a cumulative increase of 20.73 points (1.81%) compared to June 6 (the last release day of Week 23). The trend of TSI is as follows:
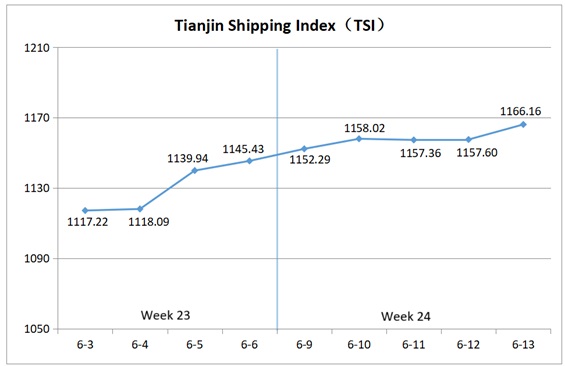
The value and trend of TSI is as follows:
II. Tianjin Container Freight Index (TCI)
In Week 24, 2025 (June 9 to June 13), the trend of Tianjin Container Freight Index (TCI) is as follows:
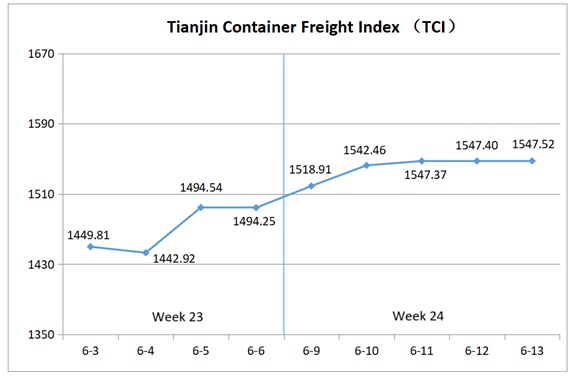
In Week 24, the TCI rose rapidly at the beginning of the week and then the upward momentum slowed.
From June 9 to June 10 (Mon. to Tue.), the freight rates of the Europe, Mediterranean West routes first declined and then rebounded, while those of American, South America East, and India routes surged significantly. The freight rates of the South America West and Central South America routes first rose and then fell, and the freight rate of the Mediterranean East route remained stable. The TCI performed strongly, with a cumulative increase of 3.23%. From June 11 to June 13(Wen. to Fri.), the freight rates of the Europe and Central South America routes remained stable with a slight increase, while those of the Mediterranean and American routes declined. The freight rate of the India route continued to be strong, and the freight rates of the South America West and South America East routes remained stable. The TCI rose slowly, with a cumulative increase of 0.33%.
Finally, the TCI closed at 1547.52 points, with a cumulative increase of 1547.52 points compared to June 6 (the last release day of Week 23), a cumulative increase of 3.56%.
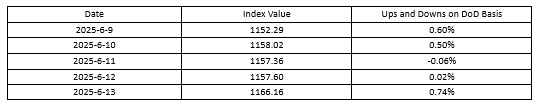
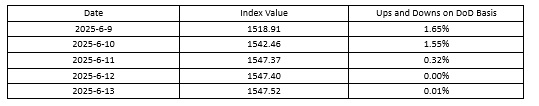
The TCI index value and several ups and downs on a day-on-day basis are as follows:
The TCI includes 19 sample routes. The main route analysis of this week is as follows:
European/Mediterranean route The market freight rates were somewhat divergent. For the European route, the spot cabin capacity remained tight, and the congestion at major ports continued, causing the freight rate to fluctuate upward. The freight index finally closed at 852.18 points, up 1.52% week-on-week. For the Mediterranean East route, the supply-demand contradiction in the market was somewhat alleviated, and some shipping companies slightly reduced prices to attract cargo. The freight index finally closed at 1332.09 points, down 1.33% week-on-week. For the Mediterranean West route, the freight rate fluctuated slightly upward, with the index value closing at 1731.61 points, up 0.07% week-on-week.
American route In the first half of the week, the market freight rates continued to rise. In the second half of the week, affected by the rapid increase in market shipping capacity, shipping companies reduced prices to attract cargo, causing the market freight rates to decline. The freight indices for the Tianjin to West America and Tianjin to East America routes closed at 1980.58 points and 1631.30 points respectively, up 7.90% and 8.41% week-on-week.
South American route The freight rate trends varied. For the South America East and Central/South America routes, urgent shipments by shippers and continuous congestion at transshipment ports of feeder vessels, pushed the freight rates to continue to climb. The freight indices closed at 2038.51 points and 2139.17 points respectively, up 24.86% and 2.45% week-on-week. For the South America West route, the cabin capacity tension was somewhat alleviated, and some shipping companies relaxed their weight restrictions to attract heavy cargo. The market freight rate first rose and then fell, with the freight index closing at 1891.63 points, down 0.53% week-on-week.
India route With fewer liner voyages and overall tight market capacity, freight rates rose significantly. The freight index of the route closed at 1013.31 points, up 20.06% week-on-week.
III. Tianjin Bulk Freight Index (TBI)
In Week 24, 2025 (June 9 to June 13), the trend of Tianjin Bulk Freight Index (TBI) was released as shown as follows:
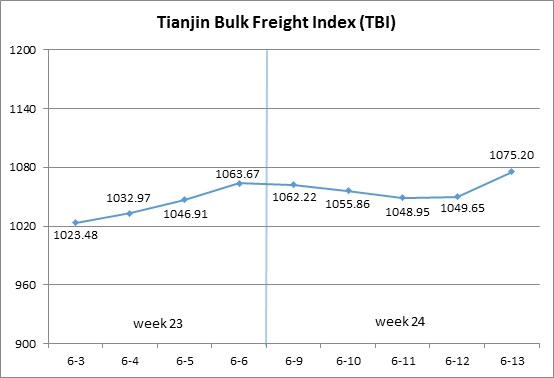
In Week 24, the TBI first declined and then rose.
From June 9 to June 11 (Mon. to Wed.), the freight rates in the grain market continued to rise, while those in the coal and metal ore markets declined. TBI showed a slight downward trend for three consecutive release days, with a cumulative decrease of 1.38%. Subsequently, the freight rates in the grain market continued to rise, while those in the coal and metal ore markets stopped falling and rebounded, driving TBI to rise again from June 12 to June 13 (Thur. to Fri.) and finally closed at 1075.20 points, with a cumulative increase of 11.53 points or 1.08% compared to June 6 (the last release day of Week 23).
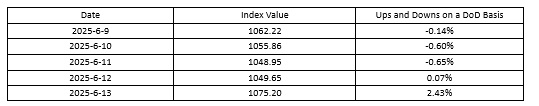
The TBI index value and several ups and downs on a day-on-day basis are as follows:
Tianjin Bulk Coal Freight Index (TBCI) Closed at 790.30 points, a cumulative increase of 8.45 points or 1.08% compared to June 6 (the last release day of Week 23). In terms of the Supramax market, the situation of abundant capacity continued, and the freight index of the Indonesia to Qingdao route continued to decline slightly, with a weekly decline of 0.30%. In terms of the Capesize market, the freight index of the Hay Point to Qingdao route fell first and then rose this week, with a week on week increase of 1.89%.
Tianjin Bulk Grain Freight Index (TBGI) Closed at 876.43 points, a cumulative increase of 6.02 points or 0.69% compared to June 6 (the last release day of Week 23). South American soybeans increased their consumption of market transportation capacity, driving market freight rates to stabilize and rebound. The freight index for the South American to Tianjin route increased by 0.55% on a weekly basis, the freight index for the US Gulf to Tianjin route increased by 0.81% on a weekly basis, and the freight index for the West American to Tianjin route increased by 0.60% on a weekly basis.
Tianjin Bulk Mineral Freight Index (TBMI) Closed at 1558.88 points, a cumulative increase of 20.14 points or 1.31% compared to June 6 (the last release day of Week 23). In terms of iron ore, the transportation demand in Australia fell, dragging down the market freight rates of the Capesize ships at the beginning of the week. In the later part of the week, the transaction volume of Brazilian Vale cargoes increased significantly, and the transportation capacity on the long-distance ore routes was tight, which supported the overall freight rates to rise again. The freight index for the route from Western Australia to Northern China increased by 0.30% week-on-week, and the freight index for the route from Brazil to Tianjin increased by 5.61% week-on-week. In terms of nickel ore, the shipment volume of nickel ore slightly increased, but the market transportation capacity remained oversupplied. The freight index for the route from Surigao to Tianjin decreased by 0.62% week-on-week.
IV. Tianjin Domestic Container Freight Index (TDI)
In Week 24 (June 9 to June 13), the trend of the Tianjin Domestic Container Freight Index (TDI) is shown in the chart below:
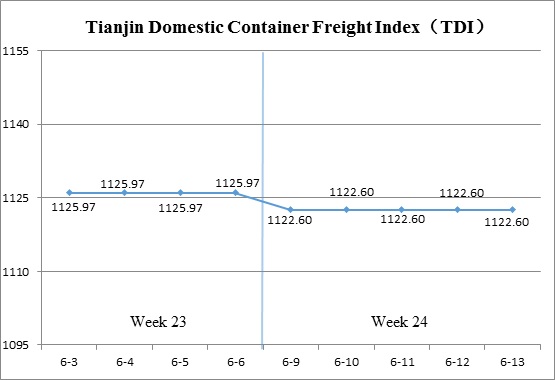
During Week 24, the Tianjin Domestic Container Freight Index saw a slight decline.
On June 9 (Mon.), the outbound index experienced a minor drop before stabilizing over the following days. The inbound index remained steady throughout the week. By June 13 (Fri.), the TDI closed at 1122.60 points, marking a cumulative decrease of 3.37 points, or 0.30%, compared to June 6 (the last release day of Week 23).
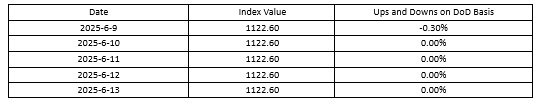
The TDI index value and several ups and downs on a day-on-day basis are as follows:
The Tianjin Domestic Container Outward Freight Index (TDOI) Recorded a modest decline, closing at 1069.68 points on June 13, a drop of 6.74 points, or 0.63%, compared to June 6 (the last release day of Week 23). In Tianjin’s domestic container shipping market, limited cargo volumes contributed to a slight decrease in freight rates on the South China route. The freight index for the Tianjin to Guangzhou closed at 1044.69 points, reflecting a 0.83% week-on-week decline. The freight indices for the Tianjin to Fujian and Tianjin to East China routes remained stable. The freight indices for the Tianjin to Quanzhou/Xiamen, and Tianjin to Shanghai routes closed at 1162.66 and 1135.83 points respectively, with no change on a week-over-week basis.
The Tianjin Domestic Container Inward Freight Index (TDII) Remained stable throughout the week, closing at 1175.51 points on June 13, unchanged from June 6 (the last release day of Week 23). In the Fujian market, cargo volumes continued to recover, with freight rates holding steady. The freight index for Quanzhou/Xiamen to Tianjin route closed at 938.30 points, showing no week-on-week change. Freight rates in the East and South China markets continued to remain stable. The freight indices for the Shanghai to Tianjin, and Guangzhou to Tianjin routes closed at 1061.42 points and 1250.66 points respectively, with no change on a week-over-week basis.
(The analysis report is for reference only and at your own risk)
