I. Tianjin Shipping Index (TSI)
In Week 25, 202(June 16 to June 20), the Tianjin Container Freight Index (TCI) saw a significant decline, and the Tianjin Bulk Freight Index (TBI) first rose and then fell. The Tianjin Domestic Container Freight Index (TDI) remained stable with a slight increase. The Tianjin Shipping Index (TSI) fell notably and finally closed at 1141.10 points, with a cumulative decline of 25.06 points or 2.15%, compared to June 13 (the last release day of Week 24). The trend of TSI is as follows:
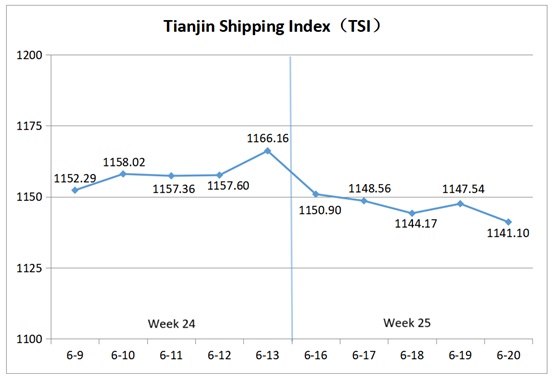
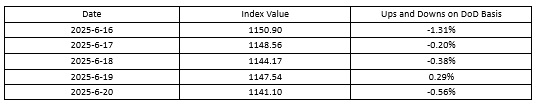
The value and trend of TSI is as follows:
II. Tianjin Container Freight Index (TCI)
In Week 25, 2025 (June 16 to June 20), the trend of Tianjin Container Freight Index (TCI) is as follows:
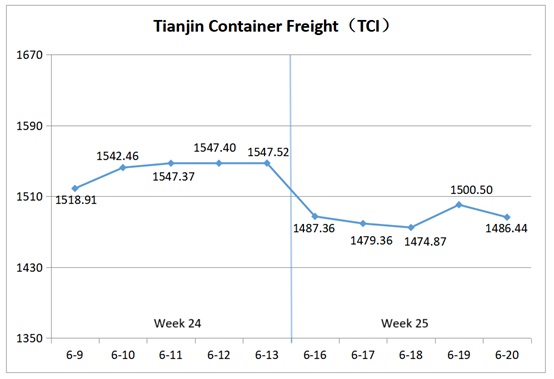
In Week 25, the TCI declined at the beginning of the week, and then fluctuated upward in the latter half of the week.
From June 16 to June 18 (Mon. to Wed.), the freight rates of the Europe and America East routes remained stable with a slight increase, while those of Mediterranean, America West, South America West and Central South America routes declined significantly. The freight rates of the South America East and Persian Gulf routes surged. The TCI fell sharply, with a cumulative decrease of 4.69% over the three release days. From June 19 to 20 (Thur. to Fri.), the freight rate of the Europe route increased significantly, the freight rate of the Mediterranean East route rose slightly, and the freight rates of the Mediterranean West and America East routes first rose and then fell. The freight rate of the America West route continued to decline, while the freight rates of the South America and Persian Gulf routes stabilized. The TCI stopped falling and rebounded, with a cumulative increase of 0.78%.
Finally, the TCI closed at 1486.44 points, with a cumulative decrease of 61.08 points or 3.95%, compared to June 13 (the last release day of Week 24).
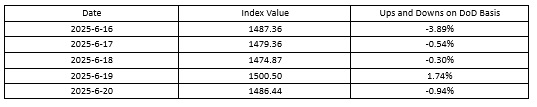
The TCI index value and several ups and downs on a day-on-day basis are as follows:
The TCI includes 19 sample routes. The main route analysis of this week is as follows:
European/Mediterranean route The freight rates showed mixed trends. For the European route, reduced shipping capacity, coupled with port congestion due to strikes in Antwerp and inefficiencies in German inland/land transport, drove shipping companies to push up the freight rates this week, with the freight index closing at 930.54 points, up 9.20% week-on-week. For the Mediterranean route, the market cargo volume declined, causing the freight rate to fluctuate downward. The freight indices for the Mediterranean East and West routes closed at 1314.45 points and 1653.57 points respectively, down 1.32% and 4.51% week-on-week.
American route The freight rates showed divergent trends. For the American West route, increased large-vessel deployments eased space constraints, and the freight rate fell sharply this week, with the freight index down 28.84% week-on-week. For the American East route, limited capacity growth and steady demand kept spot rates tight, and the freight rate fluctuated upward, with the freight index closing at 1649.60 points, up 1.12% week-on-week.
South American route For the South America East route, the market cabin capacity was tight, and shipping companies raised prices significantly. The freight index closed at 2316.69 points, up 13.65% week-on-week. For the South America West and Central South America routes, the competition for market cargo sources was fierce, causing the freight rate to fall sharply. The freight indices closed at 1317.45 points and 1966.15 points respectively, down 30.35% and 8.09% week-on-week.
Persian Gulf route Some carriers suspended bookings, while others imposed war risk surcharges. The freight rates rose significantly this week, with the index closing at 1167.21 points, up 8.78% week-on-week.
III. Tianjin Bulk Freight Index (TBI)
In Week 25, 2025 (June 16 to June 20), the trend of Tianjin Bulk Freight Index (TBI) was released as shown as follows:
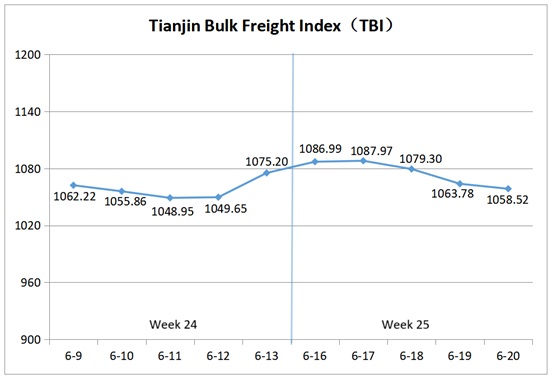
In Week 25, the TBI initially rose before declining.
From June 16 to June 17 (Mon. to Tue), the freight rates in the coal and grain markets saw modest increases, while the metal ore market rose significantly, driving the TBI upward for two consecutive release days with a cumulative gain of 1.19%. Subsequently, the freight rates in grain market continued to climb, but those in the coal and metal ore market retreated, dragging the TBI down over the next three release days (June 18 to 20, Wed. to Fri.). The TBI ultimately closed at 1058.52 points, marking a cumulative decline of 16.68 points or 1.55%, compared to June 13 (the last release day of Week 24).
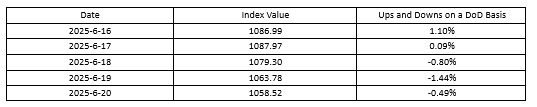
The TBI index value and several ups and downs on a day-on-day basis are as follows:
Tianjin Bulk Coal Freight Index (TBCI) Closed at 790.12 points, a cumulative decrease of 0.18 points or 0.02%, compared to June 13 (the last release day of Week 24). In terms of the Supramax market, activity was subdued initially but increased coal shipments from Southeast Asia later in the week drove a continuous slight rise in the freight index for the Indonesia to Qingdao route, resulting in a week-on-week increase of 0.86%. In terms of the Capesize market, the freight index of the Hay Point to Qingdao route rose first and then fell this week, with a week on week decline of 0.53%.
Tianjin Bulk Grain Freight Index (TBGI) Closed at 886.51 points, representing a cumulative increase of 10.08 points or 1.15% compared to June 13 (the last release day of Week 24). Sustained consumption of shipping capacity by South American soybean shipments pushed market freight rates higher. The freight index for the South America to Tianjin route rose 2.23% week-on-week, the US Gulf to Tianjin route increased 0.39%, and the West American to Tianjin route climbed 1.22% week-on-week.
Tianjin Bulk Mineral Freight Index (TBMI) Closed at 1498.92 points, marking a cumulative decrease of 59.96 points or 3.85% compared to June 13 (the last release day of Week 24). The transaction of Vale’s cargoes at the beginning of the week supported spot market freight rates. In the later week, affected by the slowdown in cargo shipments from Australian miners and the decline in FFA prices, market freight rates turned from rising to falling. The freight index for the route from Western Australia to Northern China decreased by 3.99% week-on-week, and the index for the route from Brazil to Tianjin decreased by 5.31% week-on-week. In terms of nickel ore, the increase in nickel ore shipments drove the freight index for the route from Surigao to Tianjin to stop falling and stabilize in the later week, with a week-on-week increase of 0.49%.
IV. Tianjin Domestic Container Freight Index (TDI)
In Week 25(June 16 to June 20), the trend of the Tianjin Domestic Container Freight Index (TDI) is shown in the chart below:
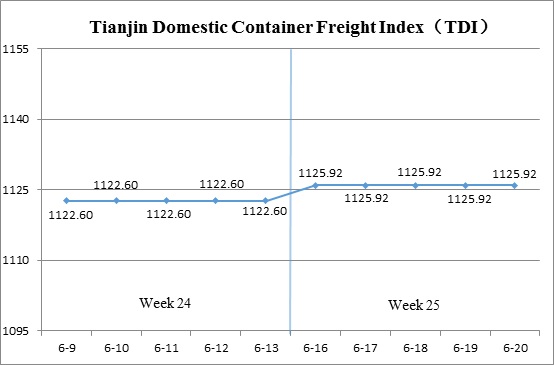
During Week 25, the Tianjin Domestic Container Freight Index saw a slight rebound.
On June 16 (Mon.), a rise in the inbound freight index led to a slight uptick in the TDI, which then stabilized over the remainder of the week. The outbound index remained steady throughout the period. By June 20 (Fri.), the TDI closed at 1125.92 points, reflecting a cumulative increase of 3.33 points, or 0.30%, compared to June 13 (the last release day of Week 24).
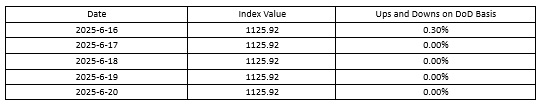
The TDI index value and several ups and downs on a day-on-day basis are as follows:
The Tianjin Domestic Container Outward Freight Index (TDOI) Remained stable, closing at 1069.68 points on June 20, unchanged from June 13 (the last release day of Week 24). Weakened coal procurement demand from downstream markets, coupled with stable domestic container shipping capacity from Tianjin, resulted in suboptimal vessel loading conditions. Despite this, freight rates remained steady. The freight indices for the Tianjin to Guangzhou, Tianjin to Quanzhou/Xiamen, and Tianjin to Shanghai routes closed at 1044.69, 1162.66, and 1135.83 points, respectively, all showing no week-on-week change.
The Tianjin Domestic Container Inward Freight Index (TDII) Edged up slightly, closing at 1182.16 points on June 20, reflecting a cumulative increase of 6.64 points, or 0.57%, compared to June 13 (the last release day of Week 24). Freight rates in the Fujian market saw a modest rise, with the Quanzhou/Xiamen to Tianjin route index reaching 975.20 points, up 3.93% week-on-week. Rates in the East and South China markets remained stable. The Shanghai to Tianjin and Guangzhou to Tianjin route indices closed at 1061.42 points and 1250.66 points respectively, both unchanged from the previous week.
(The analysis report is for reference only and at your own risk)
