I. Tianjin Shipping Index (TSI)
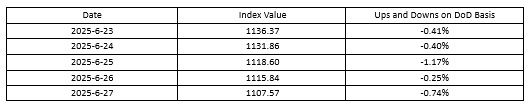
In Week 26, 202(June 23 to June 27), the Tianjin Container Freight Index (TCI) fluctuated downward, the Tianjin Bulk Freight Index (TBI) declined significantly, and the Tianjin Domestic Container Freight Index (TDI) saw an accelerated drop. As a result, the Tianjin Shipping Index (TSI)continued its downward trend and finally closed at 1107.57 points, with a cumulative decline of 33.53 points or 2.94%, compared to June 20 (the last release day of Week 25). The trend of TSI is as follows:
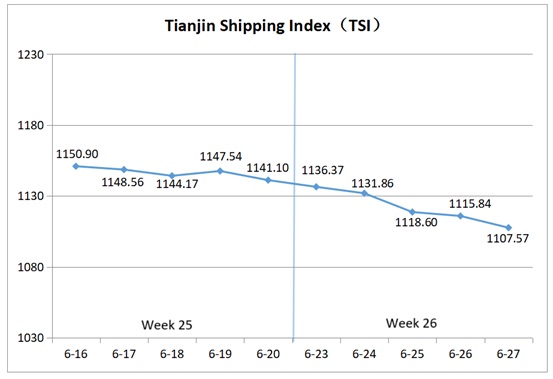
The value and trend of TSI is as follows:
II. Tianjin Container Freight Index (TCI)
In Week 26, 2025 (June 23 to June 27), the trend of Tianjin Container Freight Index (TCI) is as follows:
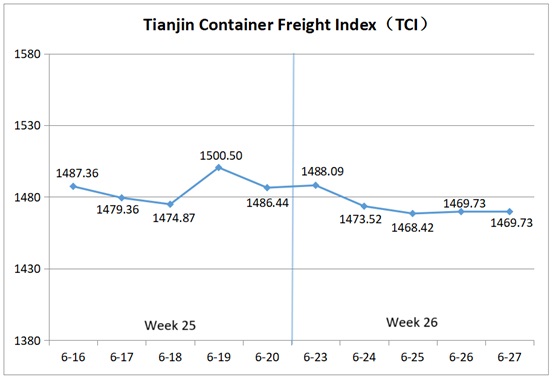
In Week 26, the TCI trended slightly downward this week.
From June 23 to 25 (Mon. to Wed.), the freight rate of the Europe route rose first and then fell, and the freight rates of America, South America West, Central South America and Persian Gulf routes dropped significantly. The decline in the freight rate of Mediterranean route was relatively small, while that of the South America East route rose strongly. Overall, the TCI fell for three consecutive release days, recording a cumulative decline of 1.21%. From June 26 to 27 (Thur. to Fri.), the decline in the freight rate of America route slowed significantly, and the freight rate of the Persian Gulf route rebounded, and the Europe, Mediterranean, and South America routes stabilized, leading to a slight 0.09% increase in the TCI.
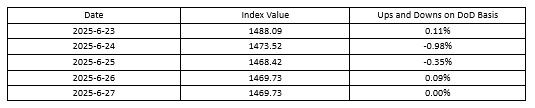
Finally, the TCI closed at 1469.73 points, with a cumulative decrease of 16.71 points or 1.12%, compared to June 20(the last release day of Week 25).
The TCI index value and several ups and downs on a day-on-day basis are as follows:
The TCI includes 19 sample routes. The main route analysis of this week is as follows:
European/Mediterranean route The freight rates showed mixed performance. For the European route, persistent port congestion and adjustments in sailing schedules by some alliances led to fluctuating but ultimately rising rates. This week, the freight rate fluctuated upward, with the freight index closing at 937.12 points, up 0.71% week-on-week. For the Mediterranean route, some carriers slashed rates aggressively, resulting in weaker performance. The freight indices for the Mediterranean East and West routes closed at 1259.69 points and 1613.42 points respectively, down 4.17% and 2.43% week-on-week.
American route Slower bookings from shippers, high vessel supply, and intense competition for cargo sources drove the freight rates to decline sharply. The freight indices for the Tianjin to American West and Tianjin to American East routes closed at 1244.11 points and 1419.96 points respectively, down 11.72% and 13.92% week-on-week.
South American route The freight rates showed diverging trends. For the South America East route, shipping companies reduced schedules, and market space was tight. The freight rates continued to rise significantly, with the freight index closing at 2565.61 points, up 10.74% week-on-week. For the South America West and Central South America routes, oversupply of capacity and lower bunker fuel prices led to steep declines of the freight rates this week. The freight indices closed at 1124.06 points and 1730.83 points respectively, down 14.68% and 11.97% week-on-week.
Persian Gulf route Market expectations were somewhat divided. some shipping companies continued to hold firm on pricing, while others chose to cut rates to attract cargo. The freight showed a clear downward trend this week, with the index closing at 1117.71 points, down 4.24% week-on-week.
III. Tianjin Bulk Freight Index (TBI)
In Week 26, 2025 (June 23 to June 27), the trend of Tianjin Bulk Freight Index (TBI) was released as shown as follows:
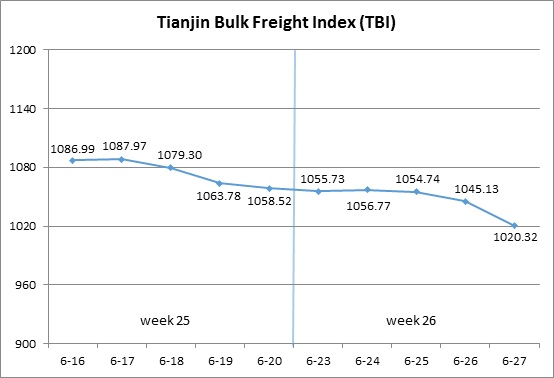
In Week 26, the TBI remained stable at the beginning of the week but showed a significant decline in the later part of the week.
From June 23 to June 25 (Mon. to Wed.), the grain market freight rates continued to rise slightly, while those in the coal and metal ore markets fluctuated and decreased slightly. The overall TBI remained stable, with a cumulative decline of 0.36% in the three release days. Subsequently, grain market freight rates further rose, while coal and metal ore market freight rates accelerated their decline, dragging down TBI’s rapid decline from June 26 to June 27 (Thur. to Fri.). The TBI ultimately closed at 1020.32 points, with a cumulative decline of 38.20 points or 3.61% compared to June 20 (the last release day of Week 25).
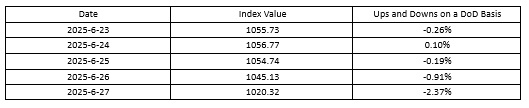
The TBI index value and several ups and downs on a day-on-day basis are as follows:
Tianjin Bulk Coal Freight Index (TBCI) Closed at 775.38 points, a cumulative decrease of 14.74 points or 1.87% compared to June 20 (the last release day of Week 25). In terms of the Supramax market, the increase in domestic import demand and the significant consumption of immediate capacity due to the addition of new cargo pallets further drove up the freight index from Indonesia to Qingdao, with a weekly increase of 1.34%. The coal cargo pallets in the Eastern Australia also increased, but the market freight rates of Capesize showed weakness, dragging down the freight index of the Hay Point to Qingdao route, which fell by 3.73% this week.
Tianjin Bulk Grain Freight Index (TBGI) Closed at 891.13 points, a cumulative increase of 4.62 points or 0.52% compared to June 20 (the last release day of Week 25). The stable transaction of soybean pallets in South America led to the continuous consumption of available capacity and further increase in market freight rates. The freight index for the South American to Tianjin route increased by 0.66% on a weekly basis, the freight index for the US Gulf to Tianjin route increased by 0.48% on a weekly basis, and the freight index for the West American to Tianjin route increased by 0.27% on a weekly basis.
Tianjin Bulk Mineral Freight Index (TBMI) Closed at 1394.46 points, a cumulative decrease of 104.46 points or 6.97% compared to June 20 (the last release day of Week 25). In terms of iron ore, Australian miners significantly slowed down their shipments, and the available capacity in the market was sufficient. The freight index for the Western Australia to Northern China route fell 9.56% week on week. The overall transaction volume of iron ore pallets in Brazil remained stable, and the freight index for the Brazil to Tianjin route was stable at the beginning of the week with slight increase. In the later part of the week, under the influence of the Pacific region’s freight rate decline, the freight index for the Brazil to Tianjin route also fell significantly, with a weekly decline of 3.22%. In terms of nickel ore, the immediate transportation capacity in the market was tight, and the freight index for the Surigao to Tianjin route increased by 2.83% on a weekly basis.
IV. Tianjin Domestic Container Freight Index (TDI)
In Week 26 (June 23 to June 27), the trend of the Tianjin Domestic Container Freight Index (TDI) is shown in the chart below:
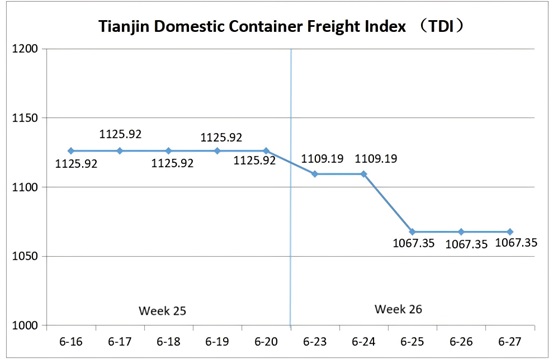
During Week 26, the Tianjin Domestic Container Freight Index declined sharply.
On June 23(Mon.), the inbound index dipped slightly, pulling the TDI weakly downward before stabilizing. On June 25 (Wed.), the outbound index dropped significantly, dragging the TDI into a steep decline. From June 26 to 27 (Thurs. to Fri.), the TDI steadied, ultimately closing at 1067.35 points, a cumulative drop of 58.57 points, or 5.20%, compared to June 20 (the last release day of Week 25).
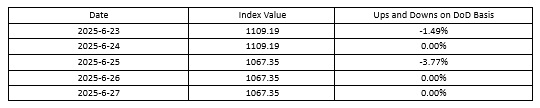
The TDI index value and several ups and downs on a day-on-day basis are as follows:
The Tianjin Domestic Container Outward Freight Index (TDOI) Fell sharply, closing at 982.82 points on June 27, down 86.86 points or 8.12% from June 20(the last release day of Week 25). Weak domestic shipping demand from Tianjin led to unsustainable freight rates, with all routes declining noticeably. . The freight indices for the Tianjin to Guangzhou, Tianjin to Quanzhou/Xiamen, and Tianjin to Shanghai routes closed at 946.59 points, 1100.83 points, and 1110.30 points respectively, down 9.39%, 5.32%, and 2.25% week-on-week.
The Tianjin Domestic Container Inward Freight Index (TDII) Edged down slightly, closing at 1151.87 points on June 27, down 30.29 points or 2.56% from June 20 (the last release day of Week 25). Freight rates in the Fujian market retreated this week, and insufficient light cargo pulled down the rates for large containers. The freight index for the Quanzhou/Xiamen to Tianjin route closed at 968.65 points, down 0.67% week-on-week. Affected by heavy rainfall in the South China market, multiple inland barge points were unable to operate, delaying cargo shipments and leading to a marked drop in market freight rates. The freight index for the Guangzhou to Tianjin route closed at 1210.23 points, down 3.23% week-on-week. Freight rates in the East China market remained stable, with the freight index for the Shanghai to Tianjin route closing at 1,061.42 points, unchanged week-on-week.
(The analysis report is for reference only and at your own risk)
