I. Tianjin Shipping Index (TSI)
In Week 28, 2025(July 7 to July 11), the Tianjin Container Freight Index (TCI) continued its decline, the Tianjin Bulk Freight Index (TBI) fluctuated narrowly, and the Tianjin Domestic Container Freight Index (TDI) edged down slightly. As a result, the Tianjin Shipping Index (TSI) trended downward and finally closed at 1073.18 points, with a cumulative decline of 9.28 points or 0.86%, compared to July 4 (the last release day of Week 27). The trend of TSI is as follows:
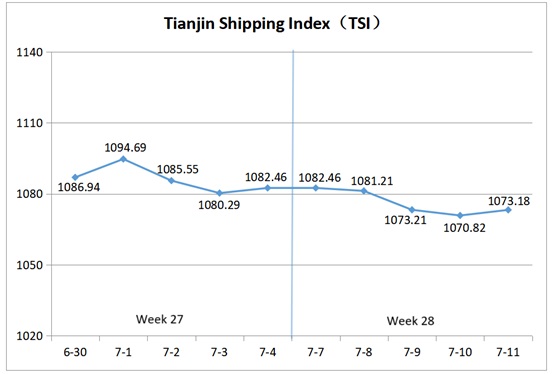
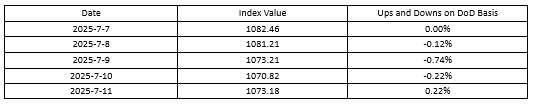
The value and trend of TSI is as follows:
II. Tianjin Container Freight Index (TCI)
In Week 28, 2025 (July 7 to July 11), the trend of Tianjin Container Freight Index (TCI) is as follows:
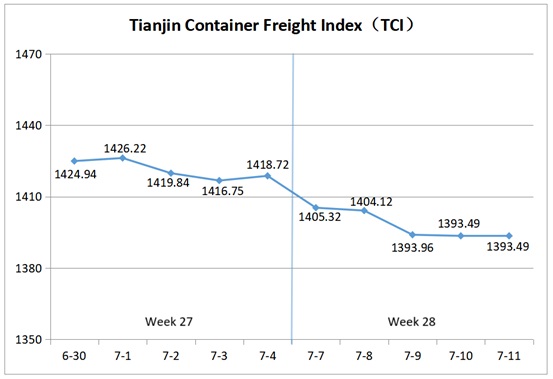
In Week 28, the TCI continued its downward trend.
From July 7 to July 9 (Mon. to Wed.), the freight rate of the East Mediterranean route fluctuated downward, that of the West Mediterranean route slipped slightly, the rates of the Central South America and Persian Gulf routes dropped significantly. The freight rate of the South America West route rose first and then fell, while that of the South America East route remained strong, and the rate for the Europe route stayed stable. As a result, the TCI kept moving downward, with a cumulative decline of 1.75% over the three release days. From July 10 to 11 (Thur. to Fri.), the freight rates of the West Mediterranean and South America routes weakened slightly, the rate for the America West route stopped falling and rebounded, and the rates for the Europe, East Mediterranean, America East, and Persian Gulf routes stabilized. The TCI inched down, with a cumulative decrease of 0.03% over the two release days.
Finally, the TCI closed at 1393.49 points, with a cumulative decrease of 25.23 points or 1.78%, compared to July 4 (the last release day of Week 27).
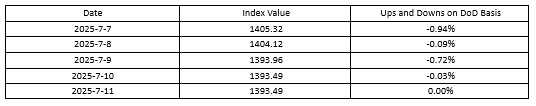
The TCI index value and several ups and downs on a day-on-day basis are as follows:
The TCI includes 19 sample routes. The main route analysis of this week is as follows:
European/Mediterranean route The freight rates showed diverging trends. For the European route, cargo volumes eased, but congestion at destination ports and carriers’ reduced calls at Hamburg and Antwerp kept rates steady. The freight index remained unchanged at 1019.55 points, up 8.80% week-on-week. For the Mediterranean route, carriers aggressively competed for cargo, pushing rates down further. The freight indices for the East Mediterranean and West Mediterranean routes closed at 1103.70 points and 1408.15 points respectively, down 2.27% and 1.72% week-on-week.
American route Market cargo volume remained sluggish, and shipping companies began to withdraw vessels and reduce voyages, putting pressure on market freight rates. Rates for the American West route dropped rapidly at the beginning of the week, and later some shipping companies tried to boost rates, narrowing the weekly decline. The freight index closed at 837.97 points, down 8.24% week-on-week. In contrast, the American East route saw a larger decline, with the index closing at 1123.31 points, down 12.96% week-on-week.
South American route The freight rates showed mixed trends. For the South America East route, cargo volume remained stable, and tight space for small containers drove market freight rates higher. The freight index closed at 2731.69 points, up 4.73% week-on-week. Shipping companies on the South America West route attempted to push up rates at the start of the week, but rates fell in the middle and later part of the week. The freight index closed at 1008.72 points, up 0.33% week-on-week. The Central South America route faced a clear oversupply, leading to a significant drop in freight rates and the index closed at 1480.13 points, down 10.50% week-on-week.
Persian Gulf route Importers reduced purchases, geopolitical tensions eased significantly, and market capacity increased, causing freight rates to drop rapidly this week. The freight index closed at 991.01 points, down 11.32% week-on-week.
III. Tianjin Bulk Freight Index (TBI)
In Week 28, 2025 (July 7 to July 11), the trend of Tianjin Bulk Freight Index (TBI) was released as shown as follows:
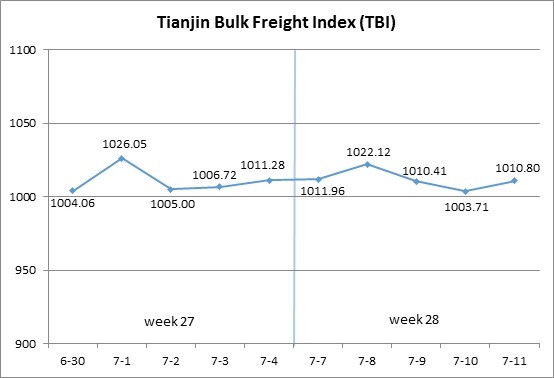
In Week 28, the TBI fluctuated narrowly.
From July 7 to July 8 (Mon. to Tue.), the coal, grain, and metal ore markets all continued to rise slightly, driving the TBI to further increase, with a cumulative increase of 1.07% on the two release days. Subsequently, the grain market freight rates continued to rise, while the coal and metal ore market freight rates fell. The TBI showed a significant decline from July 9 to July 10 (Wed. to Thur.), with a cumulative decrease of 1.80% on the two release days. On July 11 (Fri.), the coal and metal ore market freight rates rose again, and the TBI rebounded slightly and finally closed at 1010.80 points, with a cumulative decrease of 0.48 points or 0.05% compared to July 4 (the last release day of Week 27).
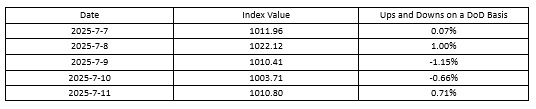
The TBI index value and several ups and downs on a day-on-day basis are as follows:
Tianjin Bulk Coal Freight Index (TBCI)Closed at 762.39 points, a cumulative decrease of 6.65 points or 0.86% compared to July 4 (the last release day of Week 27). In terms of the Supramax market, the coal cargo volume in Southeast Asia continued to grow, and the immediate available capacity was tight. The freight index of the Indonesia to Qingdao route further increased, with a weekly increase of 2.01%. In terms of the Capsize market, the freight index of the Hay Point to Qingdao route continued to rise at the beginning of the week but quickly fell back in the later part of the week, with a week over week decline of 2.07%.
Tianjin Bulk Grain Freight Index (TBGI) Closed at 910.65, a cumulative increase of 17.27 points or 1.93% compared to July 4 (the last release day of Week 27). The demand for soybean transportation in South America was stable, but the shipping capacity of Panamax ships was slightly tight, and market freight rates rose to a higher level this year. The freight index for the South American to Tianjin route increased by 3.34% on a weekly basis, the freight index for the US Gulf to Tianjin route increased by 1.25% on a weekly basis, and the freight index for the West American to Tianjin route increased by 0.53% on a weekly basis.
Tianjin Bulk Mineral Freight Index (TBMI) Closed at 1359.37 points, a cumulative decrease of 12.06 points or 0.88% compared to July 4 (the last release day of Week 27). In terms of iron ore, the cargo volume in the Australian and Brazilian markets decreased compared to the previous period, and the available capacity in the market was sufficient. The market freight rates could not continue the upward trend in the later part of last week, showing a trend of first rising and then falling during the week. The freight index for the Western Australian to Northern China route fell by 1.52% week on week, and the freight index for the Brazil to Tianjin route fell by 0.33% week on week. In terms of nickel ore, there was a significant increase in nickel ore pallets, and the market’s immediate transportation capacity was tight. The freight index for the Surigao to Tianjin route rose by 1.92% on a weekly basis.
IV. Tianjin Domestic Container Freight Index (TDI)
In Week 28 (July 7 to July 11), the trend of the Tianjin Domestic Container Freight Index (TDI) is shown in the chart below:
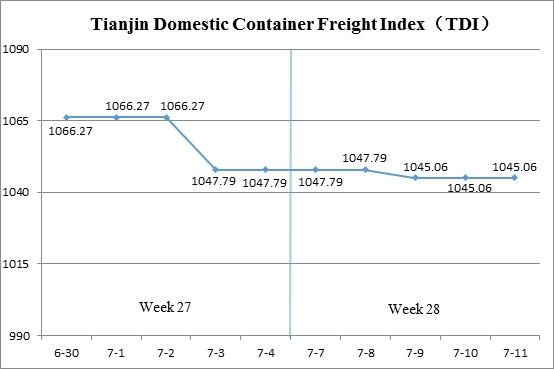
During Week 28, the decline in the Tianjin Domestic Container Freight Index narrowed.
At the beginning of the week, the Tianjin Domestic Container Freight Index remained stable. On July 9 (Wed.), a slight drop in the inbound freight index led to a modest dip in the TDI, which then returned to a steady level. By July 11 (Fri.), the TDI closed at 1045.06 points, reflecting a cumulative decrease of 2.73 points, or 0.26%, compared to July 4 (the last release day of Week 27).
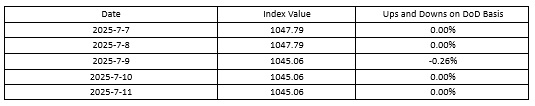
The TDI index value and several ups and downs on a day-on-day basis are as follows:
The Tianjin Domestic Container Outward Freight Index (TDOI) Remained stable, closing at 945.85 points on July 11, unchanged from July 4 (the last release day of Week 27). As the domestic outbound container shipping market from Tianjin entered the off-season, freight rates showed signs of stabilization after previous declines. The indices for the Tianjin to Guangzhou, Tianjin to Quanzhou/Xiamen, and Tianjin to Shanghai routes closed at 909.76, 1043.45, and 1110.30 points respectively, all holding steady on a week-on-week basis.
The Tianjin Domestic Container Inward Freight Index (TDII) Saw a slight decline, closing at 1144.26 points on July 11, down 5.46 points, or 0.48%, compared to July 4 (the last release day of Week 27). Freight rates in the Fujian market continued to trend downward, with the Quanzhou/Xiamen to Tianjin route index falling to 926.40 points, a week-on-week decrease of 3.17%. Rates in the South and East China markets remained stable. The indices for the Guangzhou to Tianjin and Shanghai to Tianjin routes closed at 1210.23 points and 1061.42 points respectively, both unchanged from the previous week.
(The analysis report is for reference only and at your own risk)
