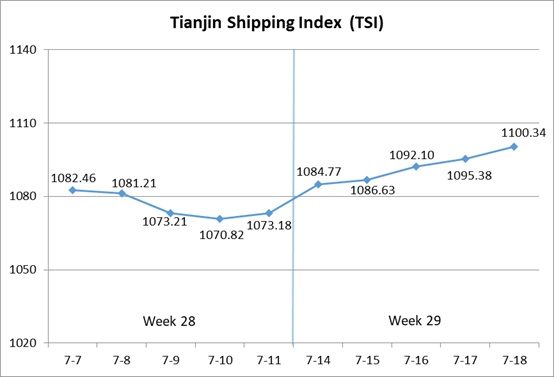
I. Tianjin Shipping Index (TSI)
In Week 29, 2025 (July.14 to July.18), Tianjin Container Freight Index (TCI) increased at first and then decreased. Tianjin Bulk Freight Index (TBI) continued to increase. Tianjin Domestic Container Freight Index (TDI) kept steady. The TSI continued to climb, eventually closing at 1100.34 points, with a cumulative increase of 27.16 points or 2.53% from Jul.11 (the last release day of Week 28). The trend of TSI is as follows:
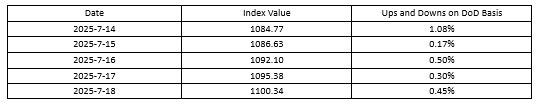
The value and trend of TSI is as follows:
II. Tianjin Container Freight Index (TCI)
In Week 29, 2025 (July.14 to July.18), the trend of Tianjin Container Freight Index (TCI) is as follows:
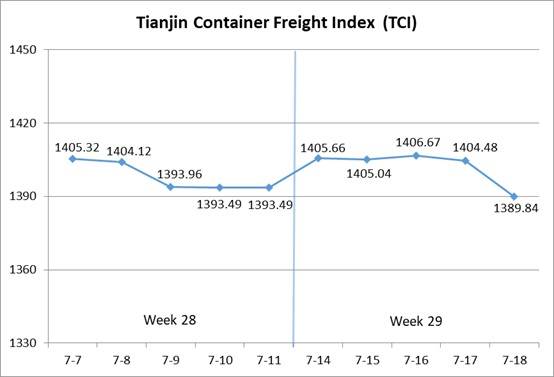
In Week 29, the TCI increased at first and then decreased.
From Jul.14-Jul.15 (Mon.-Tue.), the freight rates in European route and American West Coast route continued to increase, and the freight rates in Mediterranean route, American East Coast route, South American East route and South African route increased at first and then decreased. The freight rates in South American West route and Central and South American route continued to decrease. The TCI fluctuated upwards, with a cumulative increase of 0.83% on two releasing days. From Jul.16-Jul.18 (Wed.-Fri.), the freight rates in European route, Mediterranean route, American East Coast route, South American West route and South American East route decreased steadily, and the freight rate in American West Coast route increased at first and then decreased. The freight rate in Central and South American route decreased at first and then increased, and the freight rate in South African route increased slightly. The TCI fluctuated in a narrow range and then decreased, with a cumulative decrease of 1.08% on three releasing days.
Finally, the TCI closed at 1389.84 points, with a cumulative decrease of 3.65 points (0.26%) from Jul.11 (the last release day of Week 28).
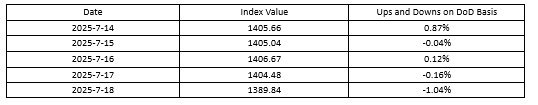
The TCI index value and several ups and downs on a day-on-day basis are as follows:
The TCI includes 19 sample routes. The main route analysis of this week is as follows:
European/Mediterranean route Freight rates showed mixed movements. On the European route, destination port congestion caused by factors such as inland river drought, strikes, and customs system upgrades led to a continuous reduction in spot available capacity. Consequently, the freight rate fluctuated upwards this week, with the index closing at 1054.56 points, with the increase of 3.43% on a week-on-week basis. On the Mediterranean route, the freight rate rose initially at the start of the week. However, carriers failed to coordinate rate hikes, leading to a subsequent decline in the freight rate later in the week. The freight indices in Mediterranean East route and Mediterranean West route closed at 1088.94 points and 1382.57 points, with the decrease of 1.34% and 1.82% on a week-on-week basis.
American route On the American West Coast route, carriers reduced capacity, leading to rate hikes by some carriers in the first half of the week. However, in the latter part of the week, some carriers slightly rolled back rates to improve vessel utilization rates. The freight index closed at 891.54 points, with the increase of 6.39% on a week-on-week basis. On the American East Coast route, replenishment demand from importers further declined, putting downward pressure on market rates. The freight index closed at 1096.53 points, with the decrease of 2.38% on a week-on-week basis.
South American route On the South American East route, market rates remained strong early in the week. However, in the mid-to-late week, some carriers increased voyages, causing a slight dip in the freight rate. The freight closed at 2896.33 points, with the increase of 6.03% on a week-on-week basis. On the South American West route, U.S. tariff policies dampened importers’ procurement demand in the region, reducing market order volumes. The freight rate continued the downward trend this week, with the index closing at 957.79 points, with the decrease of 5.05% on a week-on-week basis. On the Central and South American route, limited market cargo availability prompted carriers to primarily reduce the freight rate to attract shipments. The freight index closed at 1453.70 points, with the decrease of 1.79% on a week-on-week basis.
South African route Ongoing strikes exacerbated congestion at major South African ports. Several carriers implemented peak season surcharges (PSS), contributing to the stronger freight rate this week. The freight index closed at 2233.53 points, with the increase of 4.17% on a week-on-week basis.
III. Tianjin Bulk Freight Index (TBI)
In Week 29, 2025 (July.14 to July.18), the trend of Tianjin Bulk Freight Index (TBI) was released as shown as follows:
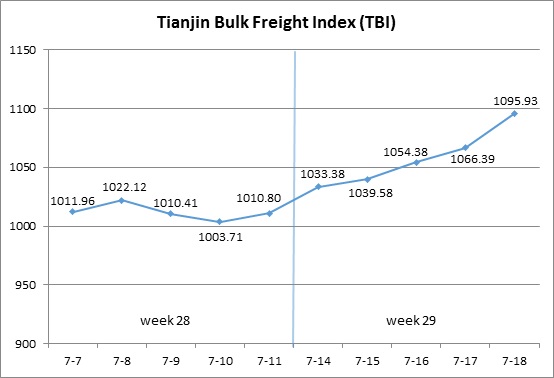
In Week 29, the TBI increased continuously.
From July 14 to July 18 (Monday to Friday), coal market freight rates continued to rise slightly, and grain market freight rates continued to rise overall, and metal ore market freight rates rose sharply, driving TBI to rise continuously throughout the week and ultimately closing at 1095.93 points, with a cumulative increase of 85.13 points or 8.42% compared with July 11 (the last release day of Week 28).
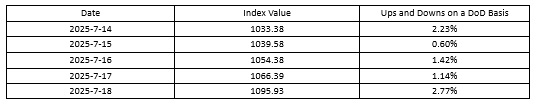
The TBI index value and several ups and downs on a day-on-day basis are as follows:
Tianjin Bulk Coal Freight Index (TBCI) Closed at 816.33 points, a cumulative increase of 53.94 points or 7.08% compared to July 11 (the last release day of Week 28). The increasing demand for imported coal in our country drove up market freight rates. In terms of Supramax market, the demand for shipping was stable, and the freight index for the Indonesia to Qingdao route increased by 2.42% on a weekly basis. In terms of the Capsize market, there was a significant increase in Australian coal pallets, which drove the weekly increase of 10.16% in the freight index of the Hay Point to Qingdao route.
Tianjin Bulk Grain Freight Index (TBGI) Closed at 944.50, with a cumulative increase of 33.85 points or 3.72% compared to July 11 (the last release day of Week 28). The demand for soybean transportation in South America slightly increased and coupled with the consumption of some Panamax ship capacity for coal transportation, market freight rates further rose. The freight index for the South American to Tianjin route increased by 4.37% on a weekly basis, the freight index for the US Gulf to Tianjin route increased by 3.59% on a weekly basis, and the freight index for the West American to Tianjin route increased by 2.13% on a weekly basis.
Tianjin Bulk Mineral Freight Index (TBMI) Closed at 1526.95 points, a cumulative increase of 167.58 points or 12.33% compared to July 11 (the last release day of Week 28). In terms of iron ore, Australian miners’ shipments increased, and the Brazilian market saw good transactions, resulting in a significant increase in market freight rates. The freight index for the Western Australia to Northern China route rose by 14.61% on a weekly basis, and the freight index for the Brazil to Tianjin route rose by 10.58% on a weekly basis. In terms of nickel ore, the market capacity was still tight, and the freight index for the Surigao to Tianjin route rose by 2.39% on a weekly basis.
IV. Tianjin Domestic Container Freight Index (TDI)
In Week 29 (July.14 to July.18), the trend of the Tianjin Domestic Container Freight Index (TDI) is shown in the chart below:
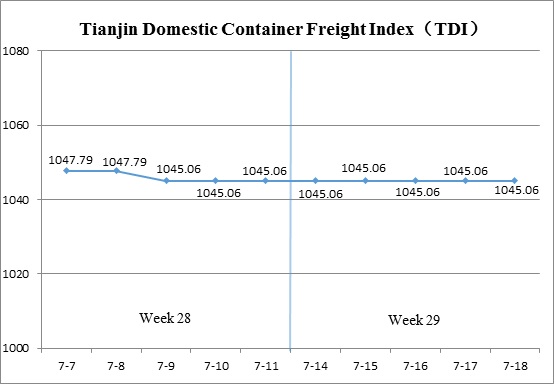
In Week 29, the Tianjin Domestic Container Freight Index stabilized.
Both the outbound and inbound indices remained steady throughout the week. By July 18 (Fri.), the TDI closed at 1045.06 points, unchanged from July 11 (the last release day of Week 28).
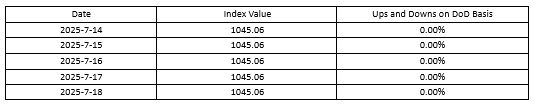
The TDI index value and several ups and downs on a day-on-day basis are as follows:
The Tianjin Domestic Container Outward Freight Index (TDOI) Remained stable, closing at 945.85 points on July 18, unchanged from July 11 (the last release day of Week 28). Hot weather conditions increased demand for thermal coal, leading to a recovery in coal production and a gradual rise in transportation volumes. Vessel loading conditions improved. In the Tianjin outbound container market, freight rates remained steady. The indices for the Tianjin–Guangzhou, Tianjin–Quanzhou/Xiamen, and Tianjin–Shanghai routes closed at 909.76 points, 1043.45 points, and 1110.30 points respectively, all showing no change from the previous week.
The Tianjin Domestic Container Inward Freight Index (TDII) Stabilized after previous declines, closing at 1144.26 points on July 18, unchanged from July 11 (the last release day of Week 28). Frequent typhoon disruptions in the South caused delays in shipping schedules, but overall market freight rates remained stable. The indices for the Guangzhou–Tianjin, Quanzhou/Xiamen–Tianjin, and Shanghai–Tianjin routes closed at 1210.23 points, 926.40 points, and 1061.42 points respectively, all remaining unchanged week-on-week.
(The analysis report is for reference only and at your own risk)
