I. Tianjin Shipping Index (TSI)
In Week 35, 2025 (Aug.25 to Aug.29), Tianjin Container Freight Index (TCI) decreased greatly. Tianjin Bulk Freight Index (TBI) rose sharply and then fell back. Tianjin Domestic Container Freight Index (TDI) decreased significantly. The TSI fluctuated downwards, eventually closing at 969.58 points, with a cumulative decrease of 22.44 points or 2.26% from Aug.22 (the last release day of Week 34). The trend of TSI is as follows:
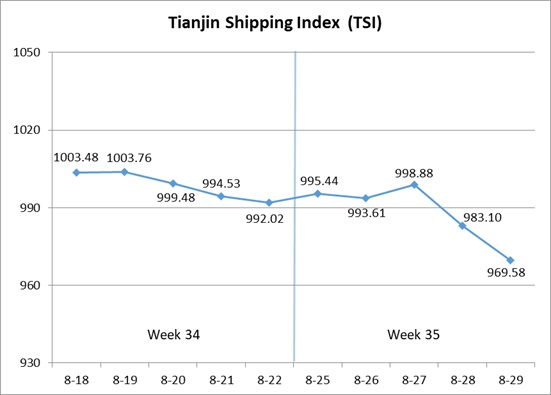
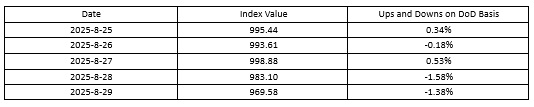
The value and trend of TSI is as follows:
II. Tianjin Container Freight Index (TCI)
In Week 35, 2025 (Aug.25 to Aug.29), the trend of Tianjin Container Freight Index (TCI) is as follows:
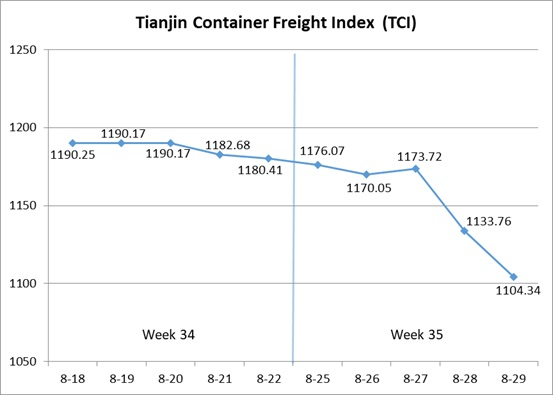
In Week 35, the TCI decreased greatly.
From Aug.25-Aug.27 (Mon.-Wed.), the freight rates in European route and South American East route decreased significantly, and the freight rates in Mediterranean West route and Central and South American route decreased slightly. The freight rates in American route, South American West route and Persian Gulf route increased. The TCI fluctuated downwards, with a cumulative decrease of 0.57% on three releasing days. From Aug.28-Aug.29 (Thur.-Fri.), the freight rates in European route, Mediterranean route and South American East route decreased greatly, and the freight rate in American route decreased at first and then increased. The freight rates in South American West route and Persian Gulf route continued to increase, and the freight rate in Central and South American route fluctuated upwards slightly. The TCI decreased greatly, with a cumulative decrease of 70 points on two releasing days.
Finally, the TCI closed at 1104.34 points, with a cumulative decrease of 76.07 points (6.44%) from Aug.22 (the last release day of Week 34).
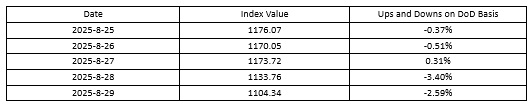
The TCI index value and several ups and downs on a day-on-day basis are as follows:
The TCI includes 19 sample routes. The main route analysis of this week is as follows:
European/Mediterranean route With sluggish market supply and ample shipping capacity, several shipping companies introduced special discounted rates to attract cargo. The freight rate in European route decreased greatly, with the freight rate index closing at 750.64 points, with the decrease of 17.16% on a week-on-week basis. In contrast, the shipping capacity on Mediterranean route decreased, and the market freight rate decline was relatively modest. The freight indices in Mediterranean East route and Mediterranean West route closed at 885.51 points and 1184.68 points, with the decrease of 2.97% and 4.28% on a week-on-week basis.
American route Freight rate trends were diverging. On the American West Coast route, shipping companies implemented a freight rate increase plan this week, with the freight rate index closing at 772.30 points, with the increase of 8.57% on a week-on-week basis. On the American East Coast route, the reduction in shipping capacity was relatively mild, with market freight rates fluctuating, showing a trend of volatile decline. The freight rate index closed at 789.27 points, with the decrease of 1.09% on a week-on-week basis.
South American route Freight rates saw mixed performance. On the South American West route, shipping companies continued to reduce capacity input, leading to tight spot space and a notable increase in the freight rate. The freight rate index closed at 1242.06 points, with the increase of 17.12% on a week-on-week basis. On the South American East route, due to weak cargo volume in the market, shipping companies intensified freight reductions, resulting in a significant decline in the freight rate. The freight rate index closed at 1424.59 points, with the decrease of 17.98% on a week-on-week basis. On the Central and South American route, the tightness of heavy cargo space noticeably eased, with the freight rate experiencing a slight fluctuation and a slight decline. The freight rate index closed at 1292.45 points, with the decrease of 0.82% on a week-on-week basis.
Persian Gulf route Market cargo volume stabilized and rebounded, with heavy cargo space and transshipment feeder vessel space remaining tight. Some shipping companies experienced overloading situations. This week the freight rate saw a significant increase, with the freight rate index closing at 912.38 points, with the increase of 11.13% on a week-on-week basis.
III. Tianjin Bulk Freight Index (TBI)
In Week 35, 2025 (Aug.25 to Aug.29), the trend of Tianjin Bulk Freight Index (TBI) was released as shown as follows:
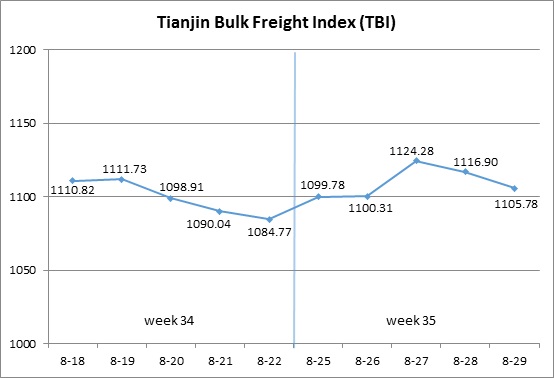
In Week 35, the TBI first increased and then fell.
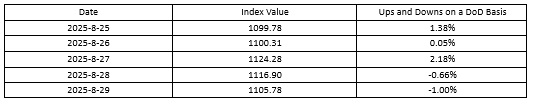
From Aug.25 to 27 (Mon. to Wed.), coal and grain market freight rates slightly increased, while the metal ore market fluctuated and rose, driving TBI to stop falling and rebound, with a cumulative increase of 3.64%. Subsequently, the grain market freight rates continued to rise slightly, while the coal and metal ore market freight rates fell significantly, which led to TBI’s continuous decline from Aug.28 to 29 (Thur. to Fri.), with a cumulative decline of 1.65%. Finally, TBI closed at 1105.78 points, a cumulative increase of 21.01 points or 1.94% compared to Aug.22 (the last release day of the 34th week).
The TBI index value and several ups and downs on a day-on-day basis are as follows:
Tianjin Bulk Coal Freight Index (TBCI) Closed at 822.45 points, a cumulative increase of 0.79 points or 0.10% compared to Aug.22 (the last release day of the 34th week). In terms of the supramax market, Indonesian coal pallets still provided support, and the freight index for the Indonesia to Qingdao route increased by 0.04% week on week. In terms of the Capsize market, Australian coal exports decreased in the later part of the week, and the freight index of the Hay Point to Qingdao route first rose and then fell, with a weekly increase of 0.13%.
Tianjin Bulk Grain Freight Index (TBGI) Closed at 945.29 points, a cumulative increase of 14.66 points or 1.58% compared to Aug.22 (the last release day of the 34th week). The concentrated trading of South American grain pallets attracted empty shipping capacity, driving market freight rates to continue rising. The freight index for the South American to Tianjin route increased by 1.49% on a weekly basis, the freight index for the US Gulf to Tianjin route increased by 1.80% on a weekly basis, and the freight index for the West America to Tianjin route increased by 0.82% on a weekly basis.
Tianjin Bulk Mineral Freight Index (TBMI) Closed at 1549.61 points, a cumulative increase of 47.59 points or 3.17% compared to Aug.22 (the last release day of the 34th week). In terms of iron ore, Australian miners were active at the beginning of the week, coupled with the rise in FFA forward contract prices, which led to a significant increase in market freight rates. The market transportation demand significantly weakened in the later part of the week, and market freight rates surged and fell back. The freight index for the Western Australia to Northern China route increased by 3.90% on a weekly basis, while the freight index for the Brazil to Tianjin route increased by 2.45% on a weekly basis. In terms of nickel ore, the transaction volume of nickel ore pallets was still acceptable, and the freight index of the Surigao to Tianjin route increased by 0.17% on a weekly basis.
IV. Tianjin Domestic Container Freight Index (TDI)
In Week 35 (Aug.25 to Aug.29), the trend of the Tianjin Domestic Container Freight Index (TDI) is shown in the chart below:
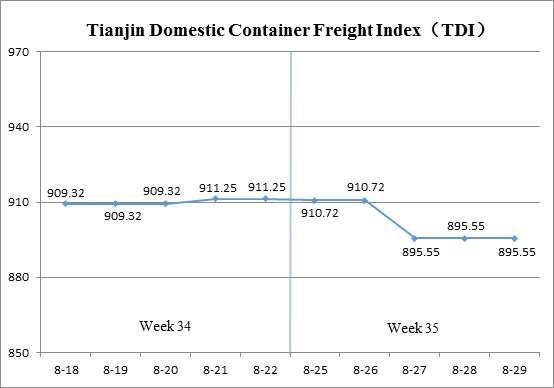
In Week 35, the Tianjin Domestic Container Freight Index saw a sharp decline.
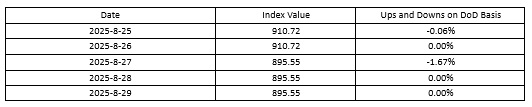
On Aug.25 (Mon.), the inbound index edged down slightly, leading the TDI to record a modest decline before stabilizing. On Aug.27 (Wed.), the outbound index dropped sharply, dragging the TDI lower once again. From Aug.28 to Aug.29 (Thur. to Fri.), the TDI held steady and ultimately closed at 895.55 points, representing a cumulative decrease of 15.70 points, or 1.72%, compared to Aug.22 (the last release day of Week 34).
The TDI index value and several ups and downs on a day-on-day basis are as follows:
The Tianjin Domestic Container Outward Freight Index (TDOI) Declined sharply, closing at 933.44 points on Aug.29, down 30.34 points, or 3.15%, compared to Aug.22 (the last release day of Week 34). Booking demand weakened significantly under the combined impact of production restrictions in North China due to environmental controls and traffic limits in port areas, driving market freight rates lower. The indices for the Tianjin–Guangzhou, Tianjin–Quanzhou/Xiamen, and Tianjin–Shanghai routes closed at 888.32, 1085.51, and 1082.57 points, respectively, representing week-on-week decreases of 3.32%, 2.77%, and 2.50%.
The Tianjin Domestic Container Inward Freight Index (TDII) Narrowed its decline, closing at 857.65 points on Aug.29, down 1.07 points, or 0.12%, compared to Aug.22 (the last release day of Week 34). Market shipments were reduced by typhoon disruptions in southern regions, keeping freight rates under pressure. Rates on the Quanzhou/Xiamen–Tianjin route continued to fall, with the index closing at 457.90 points, down 1.28% week-on-week. The Guangzhou–Tianjin and Shanghai–Tianjin routes held steady, with indices closing at 929.29 and 1061.42 points, respectively, both unchanged from the previous week.
(The analysis report is for reference only and at your own risk)
