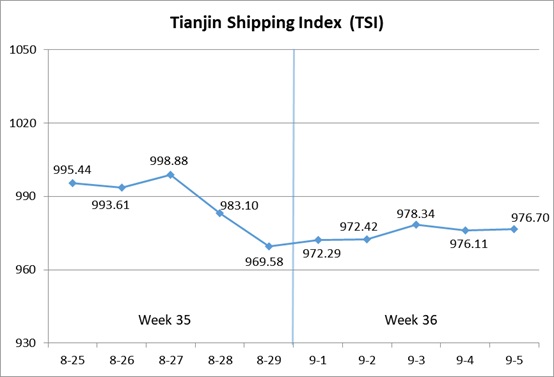
I. Tianjin Shipping Index (TSI)
In Week 36, 2025 (Sep.1 to Sep.5), Tianjin Container Freight Index (TCI) fluctuated at a low level. Tianjin Bulk Freight Index (TBI) increased at first and then decreased. Tianjin Domestic Container Freight Index (TDI) increased. The TSI fluctuated upwards, eventually closing at 976.70 points, with a cumulative increase of 7.12 points or 0.73% from Aug.29 (the last release day of Week 35). The trend of TSI is as follows:
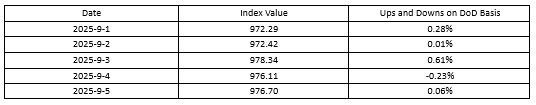
The value and trend of TSI is as follows:
II. Tianjin Container Freight Index (TCI)
In Week 36, 2025 (Sep.1 to Sep.5), the trend of Tianjin Container Freight Index (TCI) is as follows:
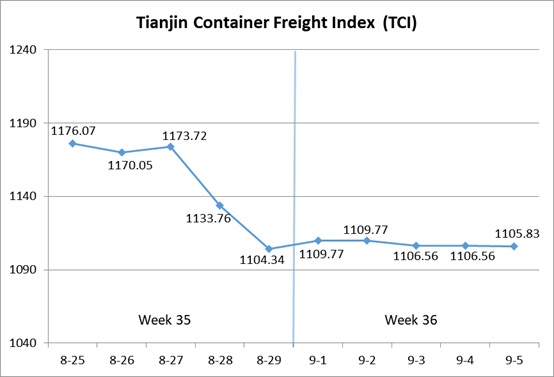
In Week 36, the TCI fluctuated within a narrow range.
From Sep.1-Sep.2 (Mon.-Tue.), the freight rates in European route, Mediterranean West route and South American West route decreased slightly, and the freight rates in American route, South American East route and Persian Gulf route showed strong performance. The freight rate in Mediterranean East route increased slightly, and the freight rate in Central and South American route kept steady. The TCI increased, with a cumulative increase of 0.49% on two releasing days. From Sep.3-Sep.5 (Wed.-Fri.), the freight rates in European route, Mediterranean route, American route and South American West route decreased slightly, and the freight rate in Persian Gulf route continued to increase. The freight rates in South American East route and Central and South American route kept steady. The TCI decreased, with a cumulative decrease of 0.36% on three releasing days.
Finally, the TCI closed at 1105.83 points, with a cumulative increase of 1.49 points (0.13%) from Aug.29 (the last release day of Week 35).
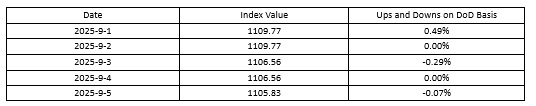
The TCI index value and several ups and downs on a day-on-day basis are as follows:
The TCI includes 19 sample routes. The main route analysis of this week is as follows:
European/Mediterranean route With limited market supply, congestion at European ports eased, and shipping companies reduced their capacity. The decline in market freight rates narrowed significantly compared to last week. The freight indices in European route, Mediterranean East route and Mediterranean West route closed at 724.22 points, 880.60 points and 1163.02 points, with the decrease of 3.52%, 0.55% and 1.83% on a week-on-week basis.
American route The shipping companies freight increase plan had been implemented, and the market freight rates continued to rise at the beginning of the week, remaining stable in the middle of the week. Later in the week, some shipping companies slightly reduced their freight rates. The freight indices in American West Coast route and American East Coast route closed at 827.56 points and 845.52 points, with the increase of 7.16% and 7.13% on a week-on-week basis.
South American route Freight rate trends were diverging. On the South American West route, due to insufficient cargo volume support, the freight rate fell this week, with the freight rate index closing at 1184.38 points, with the decrease of 4.64% on a week-on-week basis. On the South American East route, market capacity further contracted, and shipping companies pushed up the freight rate, with the freight rate index closing at 1488.65 points, with the increase of 4.50% on a week-on-week basis. On the Central and South American route, the transportation market supply and demand were in a temporary equilibrium state, with the freight rate remaining stable throughout the week, and the freight rate index maintaining at 1292.45 points, unchanged from the previous week.
Persian Gulf route The market cargo volume remained stable, with direct shipping space and heavy cargo space being tight. The freight rate further increased, and the freight rate index closed at 974.65 points, with the increase of 6.83% on a week-on-week basis.
III. Tianjin Bulk Freight Index (TBI)
In Week 36, 2025 (Sept.1 to Sept.5), the trend of Tianjin Bulk Freight Index (TBI) was released as shown as follows:
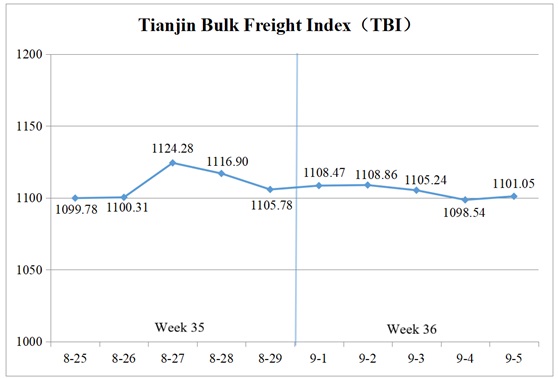
In Week 36, the TBI fluctuated within a narrow range.
From Sept.1 to 2 (Mon. to Tue.), the freight rate in the grain market decreased slightly, while those in the coal and metal ore markets rose moderately, driving the TBI up by a cumulative 0.28%. Subsequently, the freight rate in the grain market continued to decline, and the freight rates in the coal and metal ore markets turned from rising to falling, which dragged the TBI down continuously from Sept. 3 to 4 (Wed. to Thur.), with a cumulative decrease of 0.93%. On Sept. 5 (Fri.), the freight rates in the coal, grain and metal ore markets all stopped falling and stabilized, and the TBI rose slightly and finally closed at 1101.05 points, a cumulative decline of 4.73 points or 0.43% compared to Aug. 29 (the last release day of Week 35).
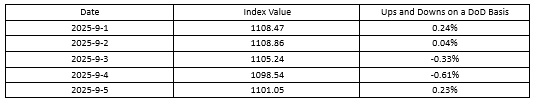
The TBI index value and several ups and downs on a day-on-day basis are as follows:
Tianjin Bulk Coal Freight Index (TBCI) Closed at 819.35 points, a cumulative decline of 3.10 points or 0.38% compared to Aug.29 (the last release day of Week 35). Coal import demand decreased, and the market average freight rate weakened slightly. In the Supramax market, coal shipments from Indonesia declined, yet the freight index for the Indonesia to Qingdao route rose 0.22% week-on-week. In the Capesize market, the freight index for the Hay Point to Qingdao route fluctuated downward, falling 0.43% week-on-week.
Tianjin Bulk Grain Freight Index (TBGI) Closed at 941.26 points, a cumulative decline of 4.03 points or 0.43% compared to Aug.29 (the last release day of Week 35). Although grain shipments from South America saw decent transaction activity, the Panamax market had ample available tonnage, leading to a decline in freight rates. The freight index for the South America to Tianjin route fell 0.54% week-on-week, while the US Gulf to Tianjin route dropped 0.37% on a weekly basis, and West America to Tianjin route declined 0.34% on a weekly basis.
Tianjin Bulk Mineral Freight Index (TBMI) Closed at 1542.53 points, a cumulative decline of 7.08 points or 0.46% compared to Aug.29 (the last release day of Week 35). In terms of iron ore, increased transaction activity at the beginning of the week drove a slight rise in freight rates. However, in the later part of the week,, miner inquiries weakened, and a decline in the price of FFA (Forward Freight Agreement) contributed to a pullback in freight rates. The freight index for the Western Australia to North China route fell 0.06% week-on-week, while the Brazil to Tianjin route dropped 1.79%. In terms of nickel ore, improved weather conditions in the Philippines led to increased transaction activity. Nevertheless, ample tonnage availability resulted in a 0.36% week-on-week decline in the freight index of the Surigao to Tianjin route.
IV. Tianjin Domestic Container Freight Index (TDI)
In Week 36 (Sep.1 to Sep.5), the trend of the Tianjin Domestic Container Freight Index (TDI) is shown in the chart below:
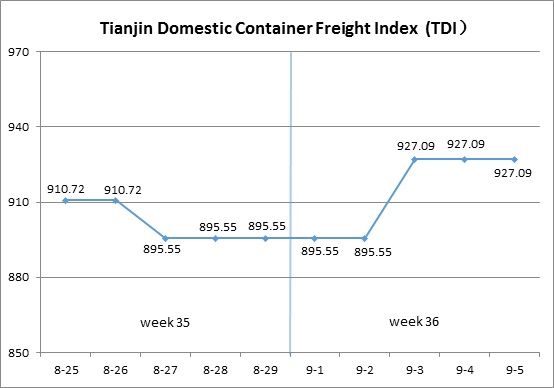
In Week 36, the Tianjin Domestic Container Freight Index rebounded significantly.
At the beginning of the week, market freight rates remained stable, and from Sep.1 to Sep.2 (Mon. to Tue.), TDI continued at the level of the later part of the previous week. On Sep.3 (Wed.), the inbound and outbound indices rose overall, driving TDI to rise sharply and return to stability in the second half of the week. On Sep.5 (Fri.), TDI closed at 927.09 points, a cumulative increase of 31.55 points or 3.52% compared to Aug.29 (the last release day of Week 35).
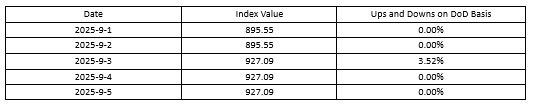
The TDI index value and several ups and downs on a day-on-day basis are as follows:
The Tianjin Domestic Container Outward Freight Index (TDOI) Increased overall and closed at 957.49 points on Sep.5, a cumulative increase of 24.05 points or 2.58% compared to Aug.29 (the last release day of Week 35). The factory’s shipment volume increased, booking demand recovered, and market freight rates rose. The freight rate indices for the Tianjin to Guangzhou route, Tianjin to Quanzhou/Xiamen route, and Tianjin to Shanghai route closed at 910.05 points, 1117.71 points, and 1113.64 points, respectively, with a week over week increase of 2.45%, 2.97%, and 2.87%, respectively.
The Tianjin Domestic Container Inward Freight Index (TDII) Rebounded significantly, closing at 896.69 points on Sep.5, a cumulative increase of 39.04 points or 4.55% compared to Aug.29 (the last release day of Week 35). The release of production capacity and demand in North China led to a rebound in freight rates from South China, Fujian, and East China to North China. The freight indices for the Guangzhou to Tianjin and Shanghai to Tianjin routes closed at 965.38 and 1113.73 points, respectively, with a week over week increase of 3.88% and 4.93%, respectively. The freight rate level of the Quanzhou/Xiamen to Tianjin route was too low, and it rose significantly this week. The freight index closed at 501.34 points, up 9.49% on a weekly basis.
(The analysis report is for reference only and at your own risk)
