I. Tianjin Shipping Index (TSI)
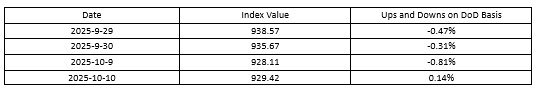
In Week 40-41, 2025 (Sep.29 to Oct.10), due to the adjusted holiday schedule for the National Day and Mid-Autumn Festival, Tianjin Shipping Index (TSI) was released four times. Tianjin Container Freight Index (TCI) decreased at first and then increased. Tianjin Bulk Freight Index (TBI) decreased significantly. Tianjin Domestic Container Freight Index (TDI) increased steadily. The TSI fluctuated downwards, eventually closing at 929.42 points, with a cumulative decrease of 13.60 points or 1.44% from Sep.26 (the last release day of Week 39). The trend of TSI is as follows:
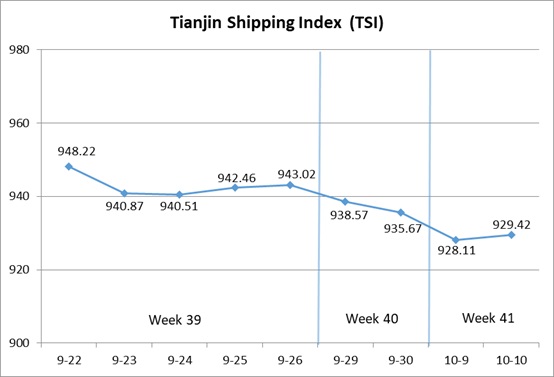
The value and trend of TSI is as follows:
II. Tianjin Container Freight Index (TCI)
In Week 40-41, 2025 (Sep.28 to Oct.11), the trend of Tianjin Container Freight Index (TCI) is as follows:
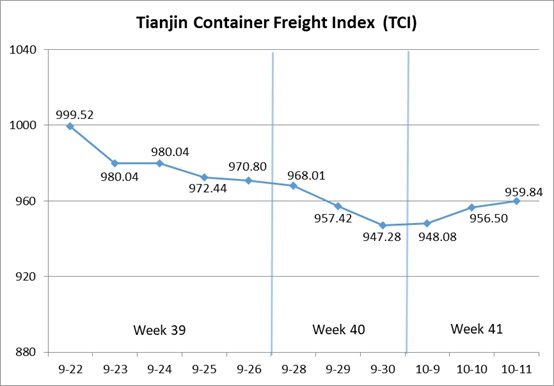
In Week 40-41, the TCI decreased at first and then increased.
During the three pre-holiday releasing days, the freight rates in European route, Mediterranean route, American route, South American East route, Central and South American route and Indian route decreased, and the freight rate in South American West route decreased at first and then increased. The TCI continued to decrease, with a cumulative decrease of 2.42%. From Oct.9-Oct.11 (Thur.-Sat.,Week 41), the freight rates in European route, Mediterranean route, American route, South American West route and Central and South American route increased, and the freight rates in South American East route and Indian route kept steady. The TCI stopped falling and rebounded, with a cumulative increase of 1.33% on three releasing days.
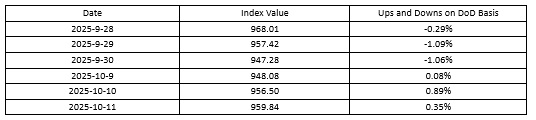
Finally, the TCI closed at 959.84 points, with a cumulative decrease of 10.96 points (1.13%) from Sep.26 (the last release day of Week 39).
The TCI index value and several ups and downs on a day-on-day basis are as follows:
The TCI includes 19 sample routes. The main route analysis of this week is as follows:
European/Mediterranean route Amid sluggish market demand, shipping companies adjusted capacity by reducing voyages and downsizing vessels, leading to continued rate declines during the three pre-holiday releasing days. After the holiday, some carriers attempted to stabilize freight rates, prompting rates to rebound. The freight indices in European route and Mediterranean East route closed at 520.89 points and 753.19 points, with the cumulative increase of 2.71% and 0.24% compared to the end of Week 39. In contrast, the freight rate in Mediterranean West route saw a sharper decline. The freight index closed at 899.89 points, with the cumulative decrease of 1.37% compared to the end of Week 39.
American route Before the long holiday, shipping companies offered special discounted rates for holiday voyages, leading to continued downward pressure on market freight rates. After the holiday, some carriers implemented rate increase plans, causing a modest rebound in freight rates. However, the gains were limited compared to the end of Week 39. The freight indices in American West Coast route and American East Coast route closed at 736.86 points and 750.65 points, with the cumulative decrease of 1.06% and 1.20%.
South American route Freight rates showed divergent trends. On the South American West route, significant blank sailings by shipping alliances tightened spot capacity, while stricter Mexican customs inspections increased clearance costs, driving market rates up sharply. The freight index closed at 785.67 points, with the cumulative increase of 11.83% over the two-week period. In contrast, on the South American East route and Central and South American route, carriers reduced rates to improve space utilization, extending the downward trend. The freight indices closed at 1200.59 points and 1085.70 points, with the cumulative decrease of 10.51% and 5.55% over the two-week period.
Indian route Freight rates remained weak before and after the holiday. With heavy cargo space already ample, light cargo space also became surplus due to slowing shipments of goods like PVC. Coupled with newly launched direct routes, the freight index dropped sharply by 8.55% over the two-week period, closing at 642.57 points.
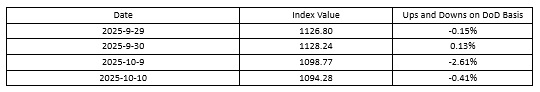
III. Tianjin Bulk Freight Index (TBI)
In Week 40-41, 2025 (Sept.28 to Oct.11), the trend of Tianjin Bulk Freight Index (TBI) was released as follows:
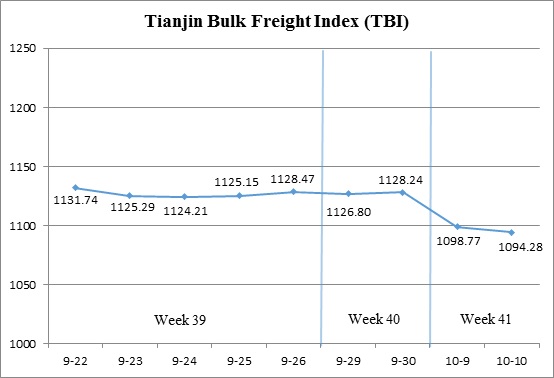
In Week 40-41, the TBI trended downward amid fluctuating market conditions.
From Sept.29-30 (Mon.-Tue.,Week 40), freight rates in the coal, grain, and metal ore markets moved within a narrow range, keeping the TBI largely stable. Following the holiday period, coal freight rates edged lower, grain freight rates weakened, and metal ore freight rates fell sharply, collectively dragging the TBI down over Oct. 9-10 (Thur.-Fri.,Week 41). The index ultimately closed at 1,094.28 points, marking a cumulative decline of 34.19 points, or 3.03%, compared to Sept. 26 (the last release day of Week 39).
The TBI index value and several ups and downs on a day-on-day basis are as follows:
Tianjin Bulk Coal Freight Index (TBCI) Closed at 822.90 points, down 13.63 points, or 1.63%, compared to Sept.26 (the last release day of Week 39). In the Supramax vessel market, oversupply of tonnage and limited Indonesian coal shipments continued to weigh on rates, with the Indonesia-Qingdao route index posting a cumulative two-week decline of 0.53%. In the Capesize segment, overall market demand remained subdued, and the Hay Point-Qingdao route index fell by 2.29% over the same period.
Tianjin Bulk Grain Freight Index (TBGI) Closed at 940.69 points, down 4.05 points, or 0.43%, compared to Sept.26 (the last release day of Week 39). In South America, grain transport supply and demand remained largely balanced, with freight rates on the South America-Tianjin and U.S. Gulf-Tianjin routes declining by 0.49% and 0.52%, respectively, over the two-week period. In contrast, transport demand in the Pacific market strengthened notably, pushing the U.S. West Coast-Tianjin route index up by 0.20%.
Tianjin Bulk Mineral Freight Index (TBMI) Closed at 1,519.26 points, down 84.89 points, or 5.29%, compared to Sept.26 (the last release day of Week 39). In the iron ore market, transport demand weakened significantly due to the holiday period, with limited new cargoes failing to absorb the available tonnage. Freight rates fell sharply, with the Australia–North China route index declining 6.09% and the Brazil-Tianjin route index down 4.90% over the two-week period. In the nickel ore market, vessel supply remained abundant, leading to a 0.84% week-on-week drop in the Surigao-Tianjin route index.
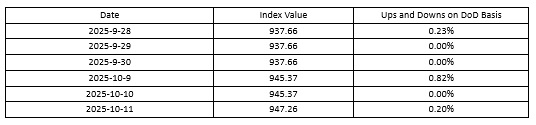
IV. Tianjin Domestic Container Freight Index (TDI)
In Week 40-41 (Sept.28 to Oct.11), the Tianjin Domestic Container Freight Index (TDI) experienced a slight increase, and the trend of the TDI is shown in the chart below:
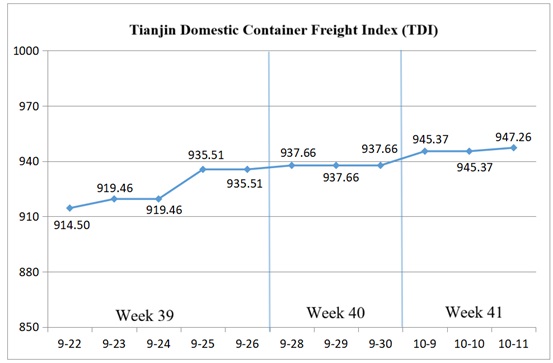
In Week 40, the inbound index rose slightly on Sept.28 (Sun.), driving a modest rise in TDI, which then stabilized afterward.
In Week 41, the inbound index climbed again on Oct.9 (Thur.), causing the TDI to rise modestly. On Oct.11(Sat.), the outbound index rose marginally, leading to a minor upward movement of TDI. Finally, TDI closed at 947.26 points, a cumulative increase of 11.75 points or 1.26% compared with Sept. 26 (the last release day of Week 39).
The TDI index value and several ups and downs on a day-on-day basis are as follows:
The Tianjin Domestic Container Outward Freight Index (TDOI) Rose slightly, closing at 998.93 points on Oct.11, a cumulative increase of 3.79 points or 0.38% compared with Sept. 26 (the last release day of Week 39). Shipment volumes increased before the National Day holiday, and shipping companies had sufficient container space to meet the booking demand both before and during the holiday, thus keeping freight rates stable. Post-holiday market shipments remained steady, with freight rates on routes to Fujian experiencing a slight increase. Specifically, the freight index for the Tianjin to Quanzhou/Xiamen route closed at 1150.98 points, up 2.24% cumulatively. The freight indices for the Tianjin to Guangzhou route and Tianjin to Shanghai route closed at 962.87 points and 1060.93 points respectively, remaining unchanged cumulatively.
The Tianjin Domestic Container Inward Freight Index (TDII) Rose continuously, closing at 895.59 points on Oct.11, cumulative increase of 19.71 points or 2.25% compared with Sept. 26 (the last release day of Week 39). Affected by weather conditions, vessel turnaround times lengthened, leading to tighter market capacity supply. Coupled with increased shipments from the Fujian market, freight rates recovered somewhat both before and after the holiday. The freight index for the Quanzhou/Xiamen to Tianjin route closed at 668.70 points, up 19.58% cumulatively. Freight rates in South China and East China remained stable, with the freight indices for the Guangzhou to Tianjin route and Shanghai to Tianjin route closed at 929.29 points and 1061.42 points respectively, both unchanged cumulatively.
(The analysis report is for reference only and at your own risk)
