I. Tianjin Shipping Index (TSI)
In Week 27, 2025(June 30 to July 4), the Tianjin Container Freight Index (TCI) declined notably, the Tianjin Bulk Freight Index (TBI) fluctuated narrowly, and the Tianjin Domestic Container Freight Index (TDI) edged down slightly. As a result, the Tianjin Shipping Index (TSI) trended lower and finally closed at 1082.46 points, with a cumulative decline of 25.11 points or 2.94%, compared to June 27 (the last release day of Week 26). The trend of TSI is as follows:
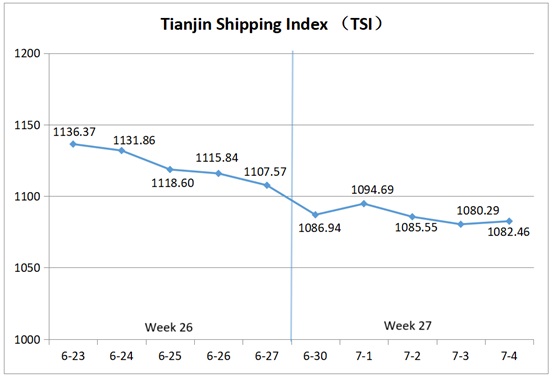
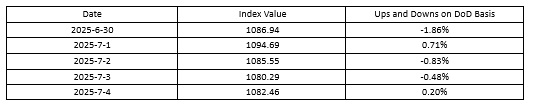
The value and trend of TSI is as follows:
II. Tianjin Container Freight Index (TCI)
In Week 27, 2025 (June 30 to July 4), the trend of Tianjin Container Freight Index (TCI) is as follows:
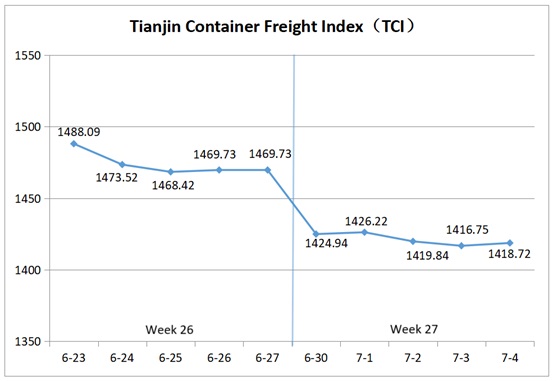
In Week 27, the TCI fell sharply at the beginning of the week and then fluctuated downward.
From June 30 to July 1 (Mon. to Tue.), the freight rate of the Europe, South America East and South Africa routes remained strong, while the freight rates of Mediterranean, American, South America West and Central South America routes declined rapidly. The TCI fell significantly, with a cumulative decrease of 2.96% over the two release days. From July 2 to 4 (Wed. to Fri.), the freight rates of the Europe, South Africa, and South America East routes strengthened overall, while those of the Mediterranean and American routes continued to decline. The freight rates of the South America West and Central South America routes remained stable. The TCI fluctuated slightly downward, with a cumulative decrease of 0.53% over the three release days.
Finally, the TCI closed at 1418.72 points, with a cumulative decrease of 51.01 points or 3.47%, compared to June 27 (the last release day of Week 26).
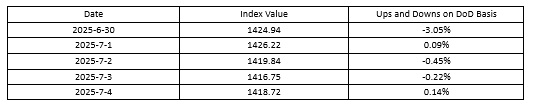
The TCI index value and several ups and downs on a day-on-day basis are as follows:
The TCI includes 19 sample routes. The main route analysis of this week is as follows:
European/Mediterranean route The freight rates showed mixed trends. For the European route, local major ports faced poor collection and distribution systems due to strikes, drought in the Rhine River. In addition, shipping companies continued to reduce voyages, freight rates rose significantly this week, with the freight index closing at 1019.55 points, up 8.80% week-on-week. For the Mediterranean route, the competition for market cargo sources was fierce, and shipping alliances cut prices significantly to attract cargo. The freight indices for the Mediterranean East and West routes closed at 1129.36 points and 1432.84 points respectively, down 10.35% and 11.19% week-on-week.
American route The previous continuous release of transportation demand, the recent rapid decline in market cargo volume, and the previous influx of shipping capacity into the route have led to a relatively obvious oversupply of shipping capacity. This week, the market freight rate continued to decline sharply. The freight indices for the Tianjin to American West and Tianjin to American East routes closed at 913.25 points and 1290.64 points respectively, down 26.59% and 9.11% week-on-week.
South American route The freight rates showed mixed trends. For the South America East route, importers continued to increase their inventory replenishment efforts, and the tight shipping capacity situation persisted, further pushing up the freight rate. The freight index closed at 2608.39 points, up 1.67% week-on-week. For the South America West and Central South America routes, the further decline in international crude oil prices and the increase in the number of ships passing through the Panama Canal dragged down the freight rate this week. The freight indices closed at 1005.36 points and 1653.83 points respectively, down 10.56% and 4.45% week-on-week.
South African route Unstable local situation in South Africa, with ongoing workers’ strikes, has caused severe congestion at ports such as Durban. Shipping companies continued to implement price increase plans, and freight rates remained strong. The freight index closed at 2124.57 points, up 5.37% week-on-week.
III. Tianjin Bulk Freight Index (TBI)
In Week 27, 2025 (June 30 to July 4), the trend of Tianjin Bulk Freight Index (TBI) was released as shown as follows:
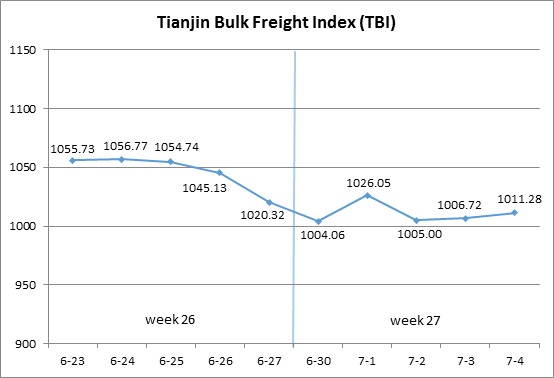
In Week 27, the TBI fluctuated narrowly.
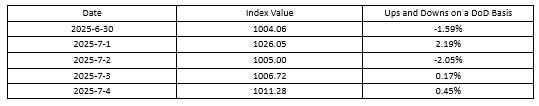
On June 30 (Mon.), the grain market saw a slight increase in freight rates, while the coal and metal ore markets continued to be weak. TBI further declined, with a day-on-day decrease of 1.59%. Subsequently, coal and grain market freight rates continued to rise slightly, while metal ore market freight rates fluctuated widely. TBI showed an overall fluctuating trend from July 1 to July 4 (Tue. to Fri.). Finally, TBI closed at 1011.28 points, a cumulative decrease of 9.04 points or 0.89% compared to June 27 (the last release day of Week 26).
The TBI index value and several ups and downs on a day-on-day basis are as follows:
Tianjin Bulk Coal Freight Index (TBCI) Closed at 769.04 points, a cumulative decrease of 6.34 points or 0.82% compared to June 27 (the last release day of Week 26). In terms of the Supramax market, there was an increase in coal cargo in Indonesia, leading to a tight demand for immediate transportation capacity. As a result, the freight index for the Indonesia to Qingdao route further increased, with a week-on-week increase of 1.24%. In terms of the Capsize market, the freight index of the Hay Point to Qingdao route fell first and then rose this week, with a week-on-week decrease of 2.07%.
Tianjin Bulk Grain Freight Index (TBGI) Closed at 893.38 points, a cumulative increase of 2.25 points or 0.25% compared to June 27 (the last release day of Week 26). The stable demand for soybean transportation in South America, coupled with the consumption of Panamax shipping capacity for coal transportation, led to further increases in market freight rates. The freight index for the South American to Tianjin route increased by 0.33% on a weekly basis, while the freight index for the US Gulf to Tianjin route increased by 0.28% on a weekly basis. In contrast, the freight index for the West American to Tianjin route decreased by 0.14% on a weekly basis.
Tianjin Bulk Mineral Freight Index (TBMI) Closed at 1371.43 points, a cumulative decline of 23.03 points or 1.65% compared to June 27 (the last release day of Week 26). In terms of iron ore, there was a divergence in the two major ocean markets this week. The freight rates for the route from Western Australia to Northern China continued to be weak at the beginning of the week, but in the later part of the week, some Australian miners rented transport capacity, which led to a rebound in market freight rates and the freight index increased by 0.01% week on week. The number of iron ore pallets in Brazil significantly decreased, and the market capacity supply was sufficient. The freight index for the Brazil to Tianjin route fell 8.59% week on week. In terms of nickel ore, the immediate transportation capacity in the market was tight, and the freight index for the Surigao to Tianjin route rose by 2.23% on a weekly basis.
IV. Tianjin Domestic Container Freight Index (TDI)
In Week 27 (June 30 to July 4), the trend of the Tianjin Domestic Container Freight Index (TDI) is shown in the chart below:
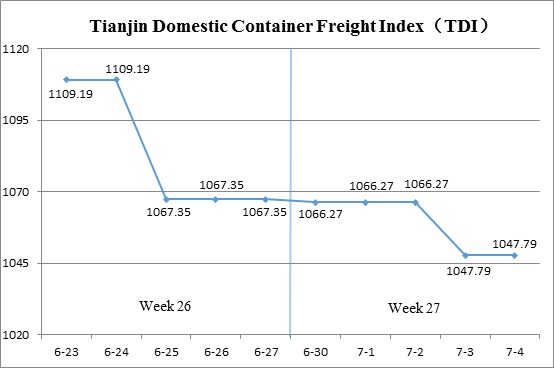
During Week 27, the Tianjin Domestic Container Freight Index continued its downward trend.
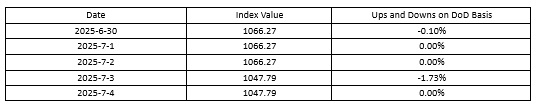
On June 30 (Mon.), the inbound index posted a slight decline. On July 2 (Tue.-Wed.), both the inbound and outbound indices remained stable, keeping the TDI steady at 1066 points during the first three release days of the week. On July 3 (Thu.), a modest decrease in the outbound index led to a slight drop in the TDI, which then stabilized again on July 4 (Fri.). The TDI ultimately closed at 1047.79 points, marking a cumulative decline of 19.56 points, or 1.83%, compared to June 27 (the last release day of Week 26).
The TDI index value and several ups and downs on a day-on-day basis are as follows:
The Tianjin Domestic Container Outward Freight Index (TDOI) Continued its downward trajectory, closing at 945.85 points on July 4. This represents a cumulative decline of 36.97 points, or 3.76%, compared to June 27 (the last release day of Week 26). In the domestic container shipping market from Tianjin, freight rates have been falling steadily in recent weeks, with shippers adopting a wait-and-see attitude. This week, rates continued to decline, though at a notably slower pace. The indices for the Tianjin to Guangzhou and Tianjin to Quanzhou/Xiamen routes closed at 909.76 and 1043.45 points, reflecting week-on-week decreases of 3.89% and 5.21% respectively. Rates on the Tianjin to Shanghai route stabilized, with the index closing at 1110.30 points, unchanged from the previous week.
The Tianjin Domestic Container Inward Freight Index (TDII) Edged down slightly, closing at 1149.72 points on July 4, a cumulative decline of 2.14 points, or 0.19%, compared to June 27 (the last release day of Week 26). Freight rates in the Fujian market continued to decline, with the Quanzhou/Xiamen to Tianjin route index closed at 956.75 points, a week-on-week decrease of 1.23%. Rates in the South and East China markets stabilized. The Guangzhou to Tianjin and Shanghai to Tianjin route indices closed at 1210.23 and 1061.42 points respectively, both unchanged from the previous week.
(The analysis report is for reference only and at your own risk)
