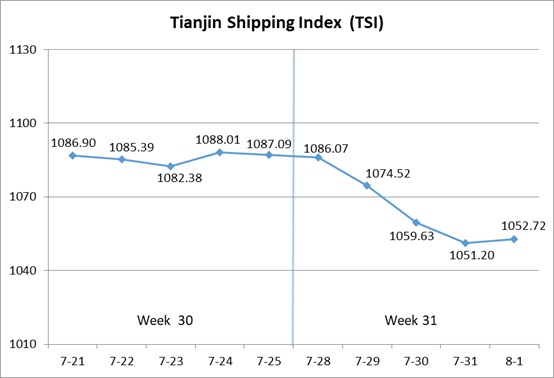
I. Tianjin Shipping Index (TSI)
In Week 31, 2025 (July.28 to Aug.1), Tianjin Container Freight Index (TCI) continued to decrease. Tianjin Bulk Freight Index (TBI) fluctuated downwards. Tianjin Domestic Container Freight Index (TDI) decreased significantly. The TSI decreased rapidly, eventually closing at 1052.72 points, with a cumulative decrease of 24.11 points or 1.81% from Jul.25 (the last release day of Week 30). The trend of TSI is as follows:
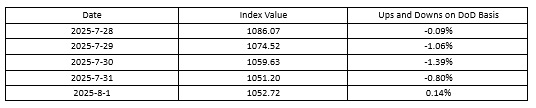
The value and trend of TSI is as follows:
II. Tianjin Container Freight Index (TCI)
In Week 31, 2025 (July.28 to Aug.1), the trend of Tianjin Container Freight Index (TCI) is as follows:
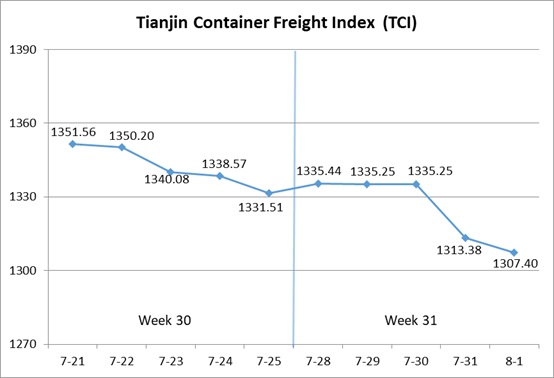
In Week 31, the TCI rebounded slightly and then continued to decrease.
From Jul.28-Jul.30 (Mon.-Wed.), the freight rates in European route, Mediterranean East route and South American West route increased steadily, and the freight rate in South African route increased significantly. The freight rates in Mediterranean West route, American East Coast route and South American East route were weak, and the freight rate in Mediterranean West route increased at first and then decreased. The freight rate in Central and South American route kept steady. The TCI increased slightly, with a cumulative increase of 0.28% on three releasing days. From Jul.31-Aug.1 (Thur.-Fri.), the freight rates in European route, Mediterranean route, American route, South American East route decreased, and the freight rate in South American West route increased strongly. The freight rates in Central and South American route and South African route increased slightly. The TCI continued to decrease, with a cumulative decrease of 2.09% on two releasing days.
Finally, the TCI closed at 1307.40 points, with a cumulative decrease of 24.11 points (1.81%) from Jul.25 (the last release day of Week 30).
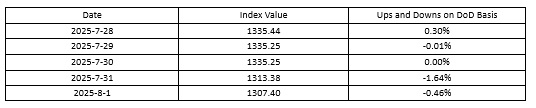
The TCI index value and several ups and downs on a day-on-day basis are as follows:
The TCI includes 19 sample routes. The main route analysis of this week is as follows:
European/Mediterranean route Freight rates saw mixed performance. On the European route, market freight rates were stable with a slight increase in the first half of the week, but freight volumes fell in the latter half, leading to a decline in the freight rate. The freight index closed at 1053.59 points, with the increase of 0.36% on a week-on-week basis. On the Mediterranean East route, some shipping companies pushed for an increase in peak season surcharges (PSS), driving up market freight rates. Other shipping companies showed limited willingness to follow suit, and the freight rate fell slightly in the latter half of the week. The freight index closed at 1065.64 points, with the increase of 1.55% on a week-on-week basis. On the Mediterranean West route, with ample space available, the market freight rate decreased, and the freight index closed at 1314.46 points, with the decrease of 2.69% on a week-on-week basis.
American route At the beginning of the week, the freight rate for American West Coast route experienced volatile increases, while the freight rate for American East Coast route continued to decrease due to excess capacity pressure. In the middle and later parts of the week, shipping companies further reduced prices to attract cargo. The freight indices in American West Coast route and American East Coast route closed at 809.67 points and 875.34 points, with the decrease of 3.66% and 7.30% on a week-on-week basis.
South American route Freight fluctuations were diverging. On the South American West route, the volume of goods such as smart home devices and auto parts continued to rebound, driving up shipping demand. Shipping companies increased the general rate, including GRI and PSS, leading to a significant surge in freight rates this week. The freight index closed at 1051.15 points, with the weekly increase of 11.73%. On the South American East route, shipping companies intensified price cuts to attract cargo sources. The freight index closed at 2560.60 points, with the decrease of 10.13% on a week-on-week basis. On the Central and South American route, due to tight space for heavy cargo, the freight rate stabilized with a slight increase this week. The freight index closed at 1423.83 points, with the increase of 1.16% on a week-on-week basis.
South African route The steady growth in market bookings drove up freight rates, with the freight rate index closing at 2411.17 points, marking a cumulative increase of 7.95% for the week.
III. Tianjin Bulk Freight Index (TBI)
In Week 31, 2025 (July 28 to Aug 1), the trend of Tianjin Bulk Freight Index (TBI) was released as shown as follows:
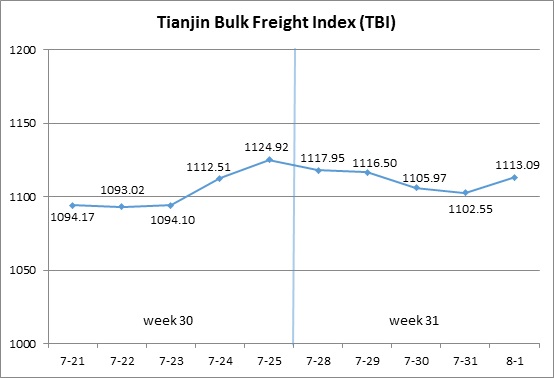
In Week 31, the TBI continued to decline slightly at the beginning of the week but stabilized slightly in the later part of the week.
From July 28 to July 31 (Monday to Thursday), the coal and grain market freight rates continued to decline slightly, while the metal ore market freight rates significantly fell, dragging down TBI’s continuous decline, with a cumulative drop of 1.99% over the four release days. Subsequently, the grain market freight rates continued to be weak, while the coal and metal ore market freight rates rebounded slightly, driving TBI to rise slightly on August 1 (Friday) and eventually close at 1113.09 points, a cumulative drop of 11.83 points or 1.05% compared to July 25 (the last release day of Week 30).
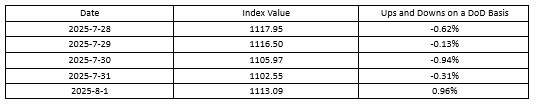
The TBI index value and several ups and downs on a day-on-day basis are as follows:
Tianjin Bulk Coal Freight Index (TBCI) Closed at 833.13 points, a cumulative decrease of 2.66 points or 0.32% compared to July 25 (the last release day of Week 30). In terms of the Supramax market, the demand for coal transportation remained positive, and the overall freight index for the Indonesia to Qingdao route remained stable. The overall market freight rates for the Capsize fell, with the freight index for the Hay Point to Qingdao route dropping by 0.51% on a weekly basis.
Tianjin Bulk Grain Freight Index (TBGI) Closed at 930.43 points, a cumulative drop of 11.72 points or 1.24% compared to July 25 (the last release day of Week 30). The demand for soybean transportation in South America continued to decrease, and the available capacity of the Panamax market increased, leading to a further decline in market freight rates. The freight index for the South American to Tianjin route decreased by 1.90% on a weekly basis, the freight index for the West American to Tianjin route decreased by 0.80% on a weekly basis, and the freight index for the US Gulf to Tianjin route decreased by 1.10% on a weekly basis.
Tianjin Bulk Mineral Freight Index (TBMI) Closed at 1575.71 points, a cumulative decrease of 21.12 points or 1.32% compared to July 25 (the last release day of Week 30). In terms of iron ore, the shipping pace of Australian and Brazilian miners slowed down, resulting in a gradual surplus of market capacity and a continuous decline in freight rates. The market demand rebounded slightly in the later part of the week, driving a slight rebound in freight rates. The freight index for the Western Australia to Northern China route decreased by 1.37% on a weekly basis, while the freight index for the Brazil to Tianjin route increased by 1.82% on a weekly basis. The overall shipment of nickel ore remained stable, and the freight index for the Surigao to Tianjin route remained unchanged on a week over week basis.
IV. Tianjin Domestic Container Freight Index (TDI)
In Week 31 (July 28-Aug 1), the trend of the Tianjin Domestic Container Freight Index (TDI) is shown in the chart below:
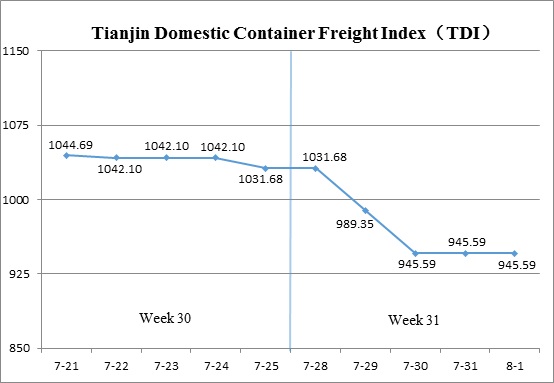
During Week 31, the Tianjin Domestic Container Freight Index saw a sharp decline.
On July 28 (Mon.), both the outbound and inbound indices remained stable. From July 29 to 30 (Tue. to Wed.), a slight increase in the outbound index was offset by a significant drop in the inbound index, leading to a steep decline in the TDI. From July 31 to August 1 (Thur. to Fri.), both indices stabilized again. By the end of the week, the TDI closed at 945.59 points, representing a cumulative decrease of 86.09 points, or 8.34%, compared to July 25 (the last release day of Week 30).
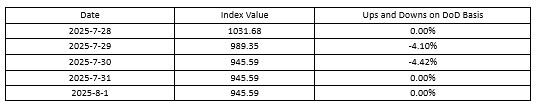
The TDI index value and several ups and downs on a day-on-day basis are as follows:
The Tianjin Domestic Container Outward Freight Index (TDOI) Continued its mild upward trend, closing at 958.28 points on August 1, marking a cumulative increase of 7.57 points, or 0.80%, compared to July 25 (the last release day of Week 30). With shipping volumes gradually recovering and vessel space tightening, freight rates on the Tianjin-Fujian route rose slightly. The index for the Tianjin-Quanzhou/Xiamen route increased to 1079.81 points, up 4.90% week-on-week. Rates on the Tianjin-Guangzhou and Tianjin-Shanghai routes remained stable, with indices closing at 918.81 and 1110.30 points, respectively, both unchanged from the previous week.
The Tianjin Domestic Container Inward Freight Index (TDII) Experienced a sharp decline, closing at 932.89 points on August 1, marking a cumulative drop of 179.75 points, or 16.16%, compared to July 25 (the last release day of Week 30). Weakened booking demand, largely due to typhoon disruptions, led to a significant drop in freight rates. Rates from South China and Fujian to North China fell notably. The Guangzhou-Tianjin route index dropped to 972.70 points, down 16.71% week-on-week, while the Quanzhou/Xiamen-Tianjin route index plunged to 702.27 points, down 23.70%. The East China market remained stable, with the Shanghai-Tianjin route index holding steady at 1061.42 points.
(The analysis report is for reference only and at your own risk)
