I. Tianjin Shipping Index (TSI)
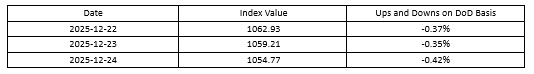
In Week 52, 2025 (Dec.22 to Dec.24), Tianjin Shipping Index was released three times as scheduled. Tianjin Container Freight Index (TCI) increased slightly. Tianjin Bulk Freight Index (TBI) decreased significantly. Tianjin Domestic Container Freight Index (TDI) increased slightly. The TSI continued to decrease, eventually closing at 1054.77 points, with a cumulative decrease of 12.11 points or 1.14% from Dec.19 (the last release day of Week 51). The trend of TSI is as follows:
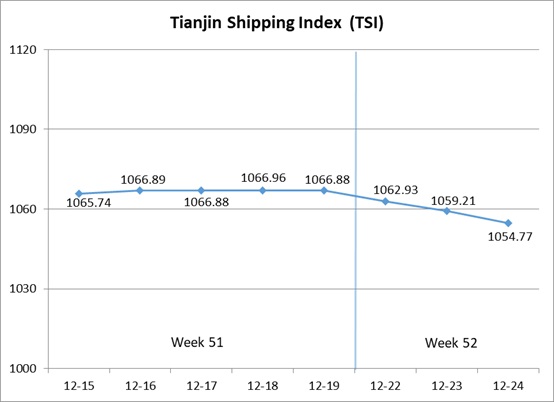
The value and trend of TSI is as follows:
II. Tianjin Container Freight Index (TCI)
In Week 52, 2025 (Dec.22 to Dec.26), the trend of Tianjin Container Freight Index (TCI) is as follows:
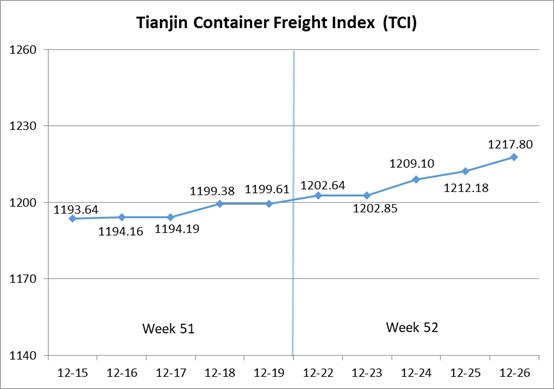
In Week 52, the TCI continued to increase.
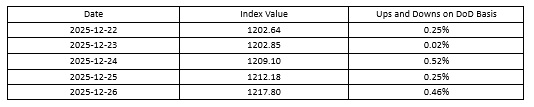
From Dec.22-Dec.23 (Mon.-Tue.), the freight rates in European route, Mediterranean route and American route increased slightly, and the freight rates in South American route, Indonesian route and Thailand-Vietnam route decreased. The TCI increased slightly, with the cumulative increase of 0.27% over the two release days. From Dec.24-Dec.26 (Wed.-Fri.), the freight rates in European route, Mediterranean route, South American East route increased greatly, and the freight rate in American route decreased slightly, and the freight rates in Indonesian route and Thailand-Vietnam route decreased. The TCI continued to increase, with the cumulative increase of 1.24% over the three release days.
Finally, the TCI closed at 1217.80 points, with the cumulative increase of 18.19 points (1.52%) from Dec.19 (the last release day of Week 51).
The TCI index value and several ups and downs on a day-on-day basis are as follows:
The TCI includes 19 sample routes. The main route analysis of this week is as follows:
European/Mediterranean route The congestion at major local ports persisted, affecting liner turnaround times. This week spot space was tight, and shipping companies continued to raise freight rates. The freight indices in European route, Mediterranean East route and Mediterranean West route closed at 766.83 points, 1156.67 points and 1499.28 points, with the increase of 10.06%, 3.79% and 6.58% on a week-on-week basis.
American route The initial period of the week saw continued tight spot market, with freight rates remaining strong. In the latter half of the week, as cargo volumes declined, market freight rates experienced a slight decrease. The freight indices in American West Coast route and American East Coast route remained at 782.40 points and 771.49 points, with the increase of 0.67% and 0.85% on a week-on-week basis.
South American route Freight rates fluctuated with divergent trends. On the South American East route, the export licensing system for steel products was about to take effect, prompting traders to expedite shipments to Brazil, Argentina, and other countries. The market freight rate experienced the volatile increase, closing at 922.06 points, with the increase of 8.29% on a week-on-week basis. In contrast, the South American West route and Central and South American route remained weak in cargo volume, with high capacity persisting. Shipping companies continued offering discounted rates to attract cargo, resulting in freight indices closing at 666.77 points and 773.55 points respectively, with the decrease of 7.97% and 4.43% on a week-on-week basis.
Southeast Asian route In the past two months, the demand for freight transportation in the market remained high, and shipping companies invested in overtime ships. With the recent decline in cargo volume, freight rates turned from high to low this week. The freight indices in Indonesian route and Thailand-Vietnam route closed at 710.60 points and 664.02 points, with the decrease of 7.60% and 7.20% on a week-on-week basis.
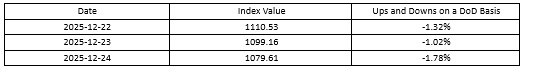
III. Tianjin Bulk Freight Index (TBI)
In Week 52, 2025 (Dec.22 to Dec.24), according to the adjusted release schedule, the Tianjin Bulk Freight Index (TBI) released 3 times, and the trend is as shown as follows:
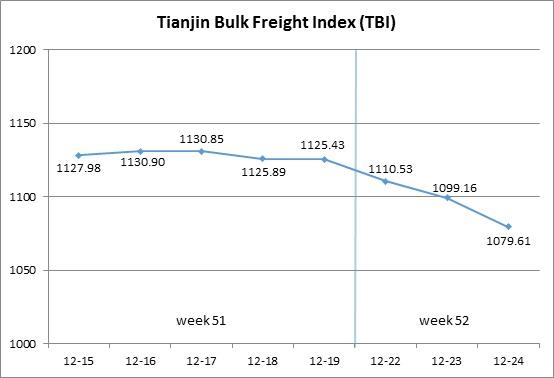
In Week 52, TBI continued to decline.
From Dec.22 to Dec.24 (Monday to Wednesday), grain market freight rates continued to be weak, while coal and metal ore market freight rates significantly fell. TBI continued to decline and eventually closed at 1079.61 points, a cumulative decrease of 45.82 points or 4.07% compared to Dec.19 (the last release day of Week 51).
The TBI index value and several ups and downs on a day-on-day basis are as follows:
Tianjin Bulk Coal Freight Index (TBCI) Closed at 839.41 points, a cumulative decrease of 31.48 points or 3.61% compared to Dec.19 (the last release day of Week 51). Domestic coal prices fell, import demand weakened, and market freight rates decreased. In terms of the supramax market, Indonesian coal cargo was scarce, and the freight index of the Indonesia to Qingdao route fell by 2.41% cumulatively. In terms of the Capsize market, the Pacific market saw a significant decline in freight rates, with the Hay Point to Qingdao route freight index dropping by 4.29% cumulatively.
Tianjin Bulk Grain Freight Index (TBGI) Closed at 889.56 points, a cumulative decrease of 13.70 points or 1.52% compared to Dec.19 (the last release day of Week 51). There was no significant increase in grain pallets, and there was an excess capacity of Panamax ships, leading to further decline in market freight rates. The freight index for the South American to Tianjin route cumulatively fell by 1.79%, the freight index for the US Gulf to Tianjin route cumulatively fell by 1.42%, and the freight index for the West America to Tianjin route cumulatively fell by 1.08%.
Tianjin Bulk Mineral Freight Index (TBMI) Closed at 1509.86 points, a cumulative decrease of 92.28 points or 5.76% compared to Dec.19 (the last release day of Week 51). In terms of iron ore, this week coincides with the overseas holiday, and the overall market atmosphere is quiet. The freight rates in the Pacific market dropped significantly, and the freight index for the route from Western Australia to Northern China fell by 7.81%. The remote mining transaction situation was slightly better, with a slower decline in market freight rates. The freight index for the Brazil to Tianjin route cumulatively fell by 0.51%. In terms of nickel ore, the market for supramax had more ships and less cargo, and the freight index of the Surigao to Tianjin route fell by 2.11%.
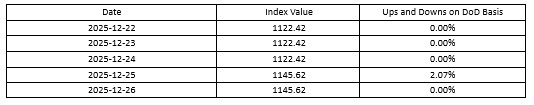
IV. Tianjin Domestic Container Freight Index (TDI)
In Week 52 (Dec.22 to Dec.26), the trend of the Tianjin Domestic Container Freight Index (TDI) is shown in the chart below:
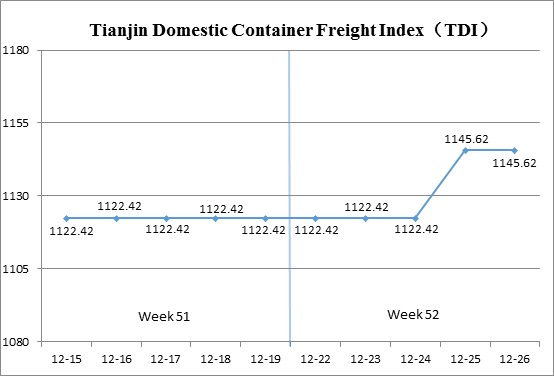
In Week 52, the Tianjin Domestic Container Freight Index saw a slight rise.
From Dec.22 to 24 (Mon. to Wed.), both the inbound and outbound coastal container freight indices remained stable. From Dec.25 to 26 (Thur. to Fri.), the outbound index edged down slightly, while the inbound index rose noticeably. This drove a modest increase in the TDI before it returned to a steady level. By the end of the period, the TDI closed at 1145.62 points, representing a week-on-week increase of 23.21 points, or 2.07%, compared with Dec.19 (the last release day of Week 51).
The TDI index value and several ups and downs on a day-on-day basis are as follows:
The Tianjin Domestic Container Outward Freight Index (TDOI) Edged down slightly, closing at 1181.94 points on Dec.26, a decrease of 1.03 points, or 0.09%, compared with Dec.19 (the last release day of Week 51). As outbound shipment demand continued to soften, freight rates on the Tianjin-Fujian trade slipped modestly, with the Tianjin-Quanzhou/Xiamen index closing at 1437.88 points, down 0.47% week on week. Rates on the South China and East China routes remained stable, with the Tianjin-Guangzhou and Tianjin-Shanghai indices closing at 1140.27 points and 1103.09 points, respectively, unchanged week on week.
The Tianjin Domestic Container Inward Freight Index (TDII) Recorded a notable increase, closing at 1109.30 points on Dec.26, up 47.44 points, or 4.47%, compared with Dec.19 (the last release day of Week 51). Toward the end of the year, vessel arrivals at Guangzhou’s Nansha Port increased, driving a significant rise in South China-Tianjin inbound freight rates. The Guangzhou-Tianjin index closed at 1192.96 points, up 5.85% week on week. Markets in East China and Fujian remained stable, with the Shanghai-Tianjin and Quanzhou/Xiamen-Tianjin indices closing at 1049.39 points and 807.97 points, respectively, both unchanged week on week.
(The analysis report is for reference only and at your own risk)
